Cross-Channel Monthly PPC Report
Automatically generate a cross-channel monthly PPC report in Google Slides using Google Ads, Meta Ads, and TikTok Ads data, complete with blended KPIs, charts, and AI-written insights in minutes.
Built with
 Meta Ads
 Google Ads
 TikTok Ads
 Google Slides
 AI
AIThis monthly PPC report template for Google Ads, Meta Ads (Facebook/Instagram), and TikTok Ads automatically blends your paid media performance into a single Google Slides deck—generated end-to-end inside Markifact.
It connects to your ad accounts, pulls the latest reporting-period metrics, normalizes cross-channel KPIs, runs AI analysis, and fills a polished, client-ready performance report you can share in minutes.
Instead of exporting CSVs, fixing spreadsheets, rebuilding charts, and rewriting the same commentary every month, you get a reusable cross-channel paid media report that stays consistent, accurate, and easy to understand—every time you run it.
You can use this step-by-step video to see how to customize and update the workflow, connect your accounts, and tailor the Google Slides layout to your brand:
What This Template Does
This template is built for cross-channel PPC reporting and focuses on the questions stakeholders actually care about:
- How are Google Ads, Meta Ads, and TikTok Ads performing together as one paid media program?
- Which campaigns/ad sets/ad groups are driving results, and which are wasting spend?
- How are spend, conversions, CPA, ROAS, CTR, and CVR trending over time?
- Where should we scale budgets, and where should we cut or optimize?
Under the hood, it works like a flexible digital marketing report template that:
- Connects to Google Ads, Meta Ads, and TikTok Ads
- Collects performance data for your selected date range (monthly by default)
- Blends cross-channel metrics into a unified view
- Generates charts, tables, and visual summaries
- Adds AI-written insights and highlights directly into your Google Slides deck
The result is a consolidated monthly PPC report you can reuse without rebuilding the structure.
Key Benefits
1) True Cross-Channel View (Not 3 Separate Exports)
Stop bouncing between platforms or stitching screenshots together. This report gives you:
- Combined totals (spend, impressions, clicks, conversions, revenue)
- Side-by-side channel comparisons (Google vs Meta vs TikTok)
- Top campaigns across platforms in one blended view
2) Automated, Recurring Monthly Reporting
If you build the same report every month, this replaces the manual grind:
- Run it at the end of each reporting period
- Generate a fresh monthly deck with current data
- Keep a consistent format your team and clients recognize
3) Executive-Ready Storytelling With AI Insights
Numbers alone don’t explain why performance changed. AI highlights:
- What improved or dropped vs the previous period
- Which channels/campaigns drove the best return
- Notable efficiency shifts (CPA/ROAS/CVR changes)
- Clear opportunities for scaling, optimization, or reallocation
4) No Design Skills Required
The Google Slides layout is already built for performance reporting:
- Clean slide structure and modern design
- Preconfigured charts and tables
- Sections for channel overviews, campaign breakdowns, and key takeaways
Customize fonts/colors once, and every future run reuses your updated design while refreshing the data and insights.
Example Use Cases
Monthly Paid Media Review
- Present cross-channel PPC performance for the month
- Compare vs last month or targets
- Highlight winners/losers by channel and campaign
- Capture next steps directly in the deck
Agency Client Reporting
- Standardize reporting across clients
- Spend less time building decks and more time optimizing accounts
- Deliver one unified paid media report (not three platform PDFs)
- Maintain a consistent “agency reporting standard” every month
In-House Growth & Performance Teams
- Align marketing + finance + leadership around one set of numbers
- Give stakeholders a clear cross-channel view they can follow
- Quickly spot underperforming channels/campaigns
- Use AI insights to support budget decisions and testing roadmaps
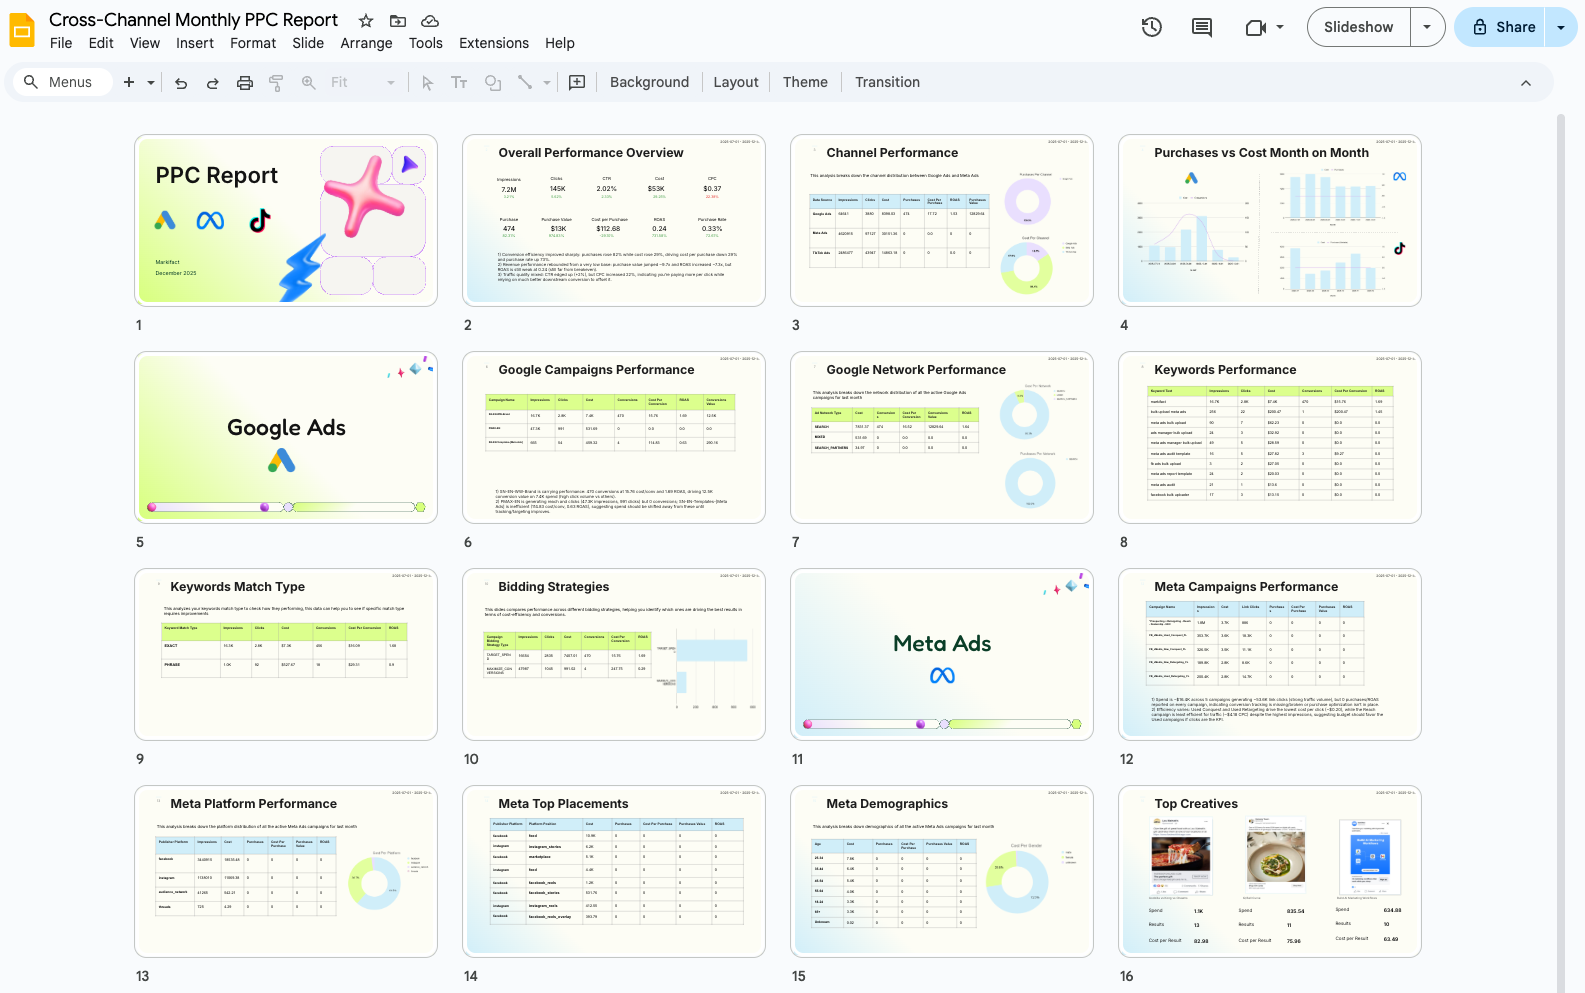
What The Report Includes
A typical run includes:
Executive Summary
Total spend, conversions, CPA, ROAS (blended + by channel).Channel Breakdown
Google vs Meta vs TikTok performance comparison.Top Campaigns
Tables/charts for top campaigns by spend, conversions, CPA, or ROAS across all platforms.Trends Over Time
Time-series charts for key KPIs to spot patterns and seasonality.AI-Generated Insights
Narrative highlights (wins, risks, anomalies, opportunities).Recommendations Section
Space for your notes so the deck becomes an action plan—not a data dump.
How It Works
Data Collection
Markifact connects to your Google Ads, Meta Ads, and TikTok Ads accounts and pulls key metrics for your selected date range.Normalization & Blending
Metrics are standardized and combined so you can view performance as one program (plus channel-level breakouts).AI Analysis
AI flags meaningful changes, such as:- Standout ROAS/CPA shifts
- Significant spend reallocations
- Performance anomalies worth investigating
- Scaling and optimization opportunities
Charts & Tables
Visuals are generated for trends, channel comparisons, and top campaign performance.Google Slides Population
The deck is auto-filled:- Text placeholders replaced with AI summaries
- Charts updated with current reporting data
- Tables refreshed with the latest performance metrics
Sharing
You get a ready-to-present Google Slides deck you can share with clients or stakeholders (and export to PDF if needed).
Setup Instructions
Make a Copy of the Templates
Copy the provided Google Slides and Google Sheets templates to your Google Drive.Connect Google Drive & Select Templates
Paste the Slides/Sheets URLs into the corresponding nodes inside the workflow.Connect Your Ad Accounts
Connect Google Ads, Meta Ads, and TikTok Ads inside Markifact.Run the Workflow
Generate your first monthly deck, review it, tweak the slide design if needed, then reuse the same setup every month.
Who This Template Is For
- Performance marketers running Google Ads + Meta + TikTok
- Agencies that need repeatable, client-ready monthly PPC reporting
- Marketing managers who want a clean executive deck for stakeholders
- Growth teams that rely on cross-channel reporting for budget decisions
If your current process involves exporting from multiple platforms, rebuilding charts, and manually writing commentary, this t
Related Templates
Discover more marketing workflow templates to automate your tasks
Google & Meta Ads Consolidated Monthly Slides
Generate consolidated Google & Meta Ads performance reports in Google Slides with AI-enhanced insights and visualizations.
Meta Ads Bulk Uploader via Google Sheets
Create dozens of Meta ads in minutes by uploading your entire campaign structure from a single Google Sheet, eliminating tedious manual ad creation.

Google Ads Audit Checklist
Say goodbye to manual Google Ads audits. Run a full account check in minutes with over 40 automated checks.


Monthly SEO Performance Slides
Generate comprehensive monthly SEO reports in Google Slides using data from Google Search Console and Google Analytics with AI insights.

Competitor Ads Spy
Export competitor ads from Google, Meta, LinkedIn, and TikTok into Google Sheets for instant analysis and research.
Meta Ads Audit Checklist
Say goodbye to manual Meta Ads audits. Run a full account check in minutes with over 100 data points


GMC Price Benchmarks Labelizer
Turn Google Merchant Center’s price benchmarks into daily custom labels you can use in Google Ads to scale campaigns by competitiveness.
TikTok Ads Bulk Uploader via Google Sheets
Bulk upload TikTok ads from Google Sheets. Create Spark Ads, video ads, image ads, carousel ads, catalog ads, and lead ads in one sheet, then upload them to TikTok Ads with Markifact.
AI Brand Mention Tracker (AEO / GEO)
Automatically track whether ChatGPT, Claude, Gemini, and Google AI experiences mention your brand (and include your link) for any keyword prompt, then log results to Google Sheets over time.


10,000+ marketers scaling with AI.
Can't find what you're looking for?
Describe your marketing automation needs and let our AI build a custom workflow for you.
Ready to automate your marketing?
Sign up now and let Markifact handle the busy work so you can focus on growth.