

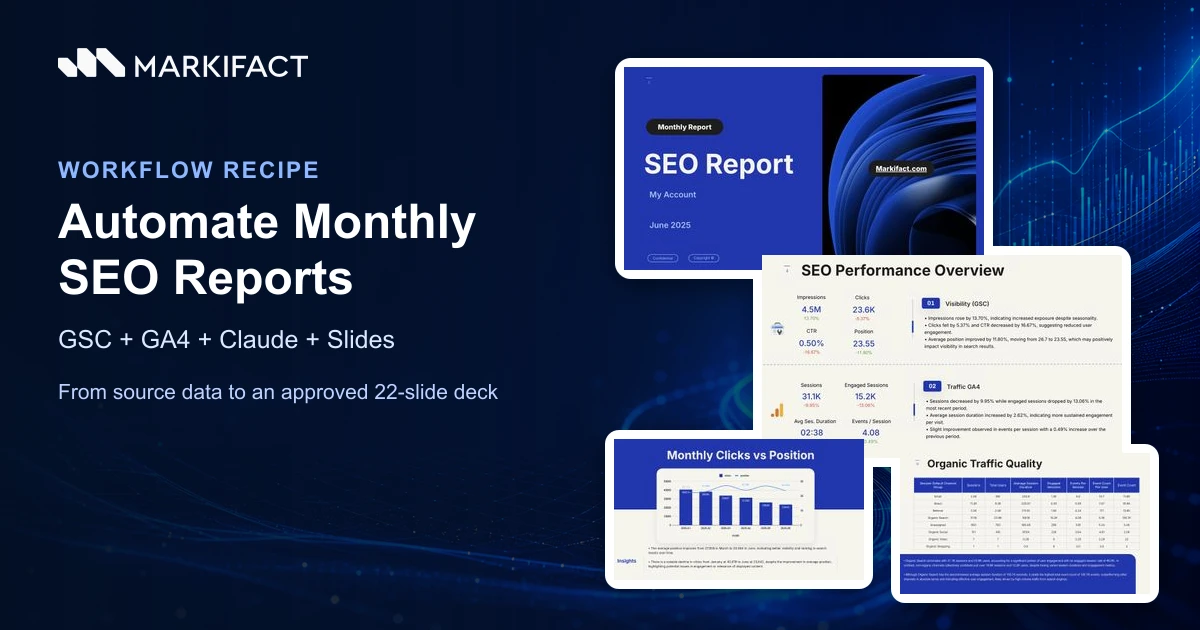
You can automate monthly SEO reports by pulling a complete reporting period from Google Search Console and GA4, calculating comparisons before AI writes anything, and updating a reusable Google Slides deck through stable identifiers. Search Console should explain search visibility, while GA4 should explain what organic visitors did after they arrived. Claude can draft the narrative, but a human should still verify the properties, dates, calculations, claims, and recommendations before the report reaches a client.
What an automated monthly SEO report should do
A useful monthly SEO report answers three different questions:
- Did search visibility change? Use Search Console clicks, impressions, CTR, average position, queries, pages, devices, and countries.
- Did organic traffic quality change? Use GA4 organic sessions, engaged sessions, key events, and other agreed onsite outcomes.
- What should we investigate or do next? Use evidence from the first two layers, then require human approval for the recommendations.
The workflow is more reliable when those layers remain separate. Search Console clicks and GA4 sessions are related, but they are not interchangeable. One measures activity on Google Search results, while the other measures sessions recorded on the site.
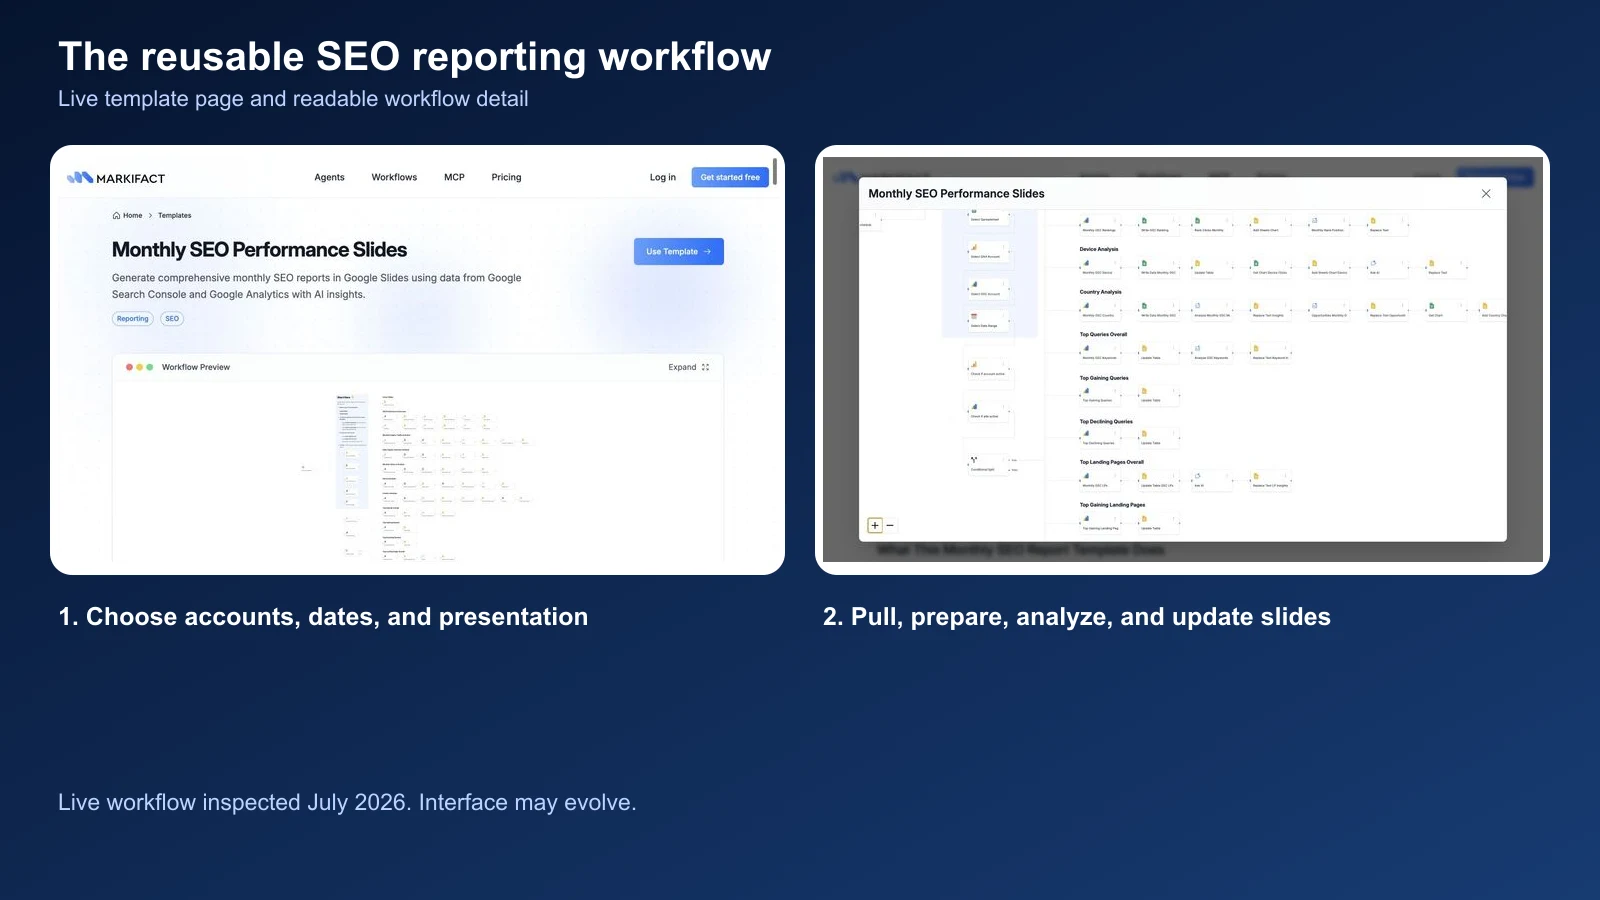
The Monthly SEO Performance Slides template connects Google Search Console, Google Analytics, Google Sheets, AI, and Google Slides. You select the accounts, reporting dates, and presentation, then run a reusable workflow that prepares tables, writes draft insights, and updates the deck.
The complete 22-slide SEO report structure
The report is not a generic collection of charts. It uses a fixed narrative architecture, so the workflow always knows where each metric, table, and insight belongs.
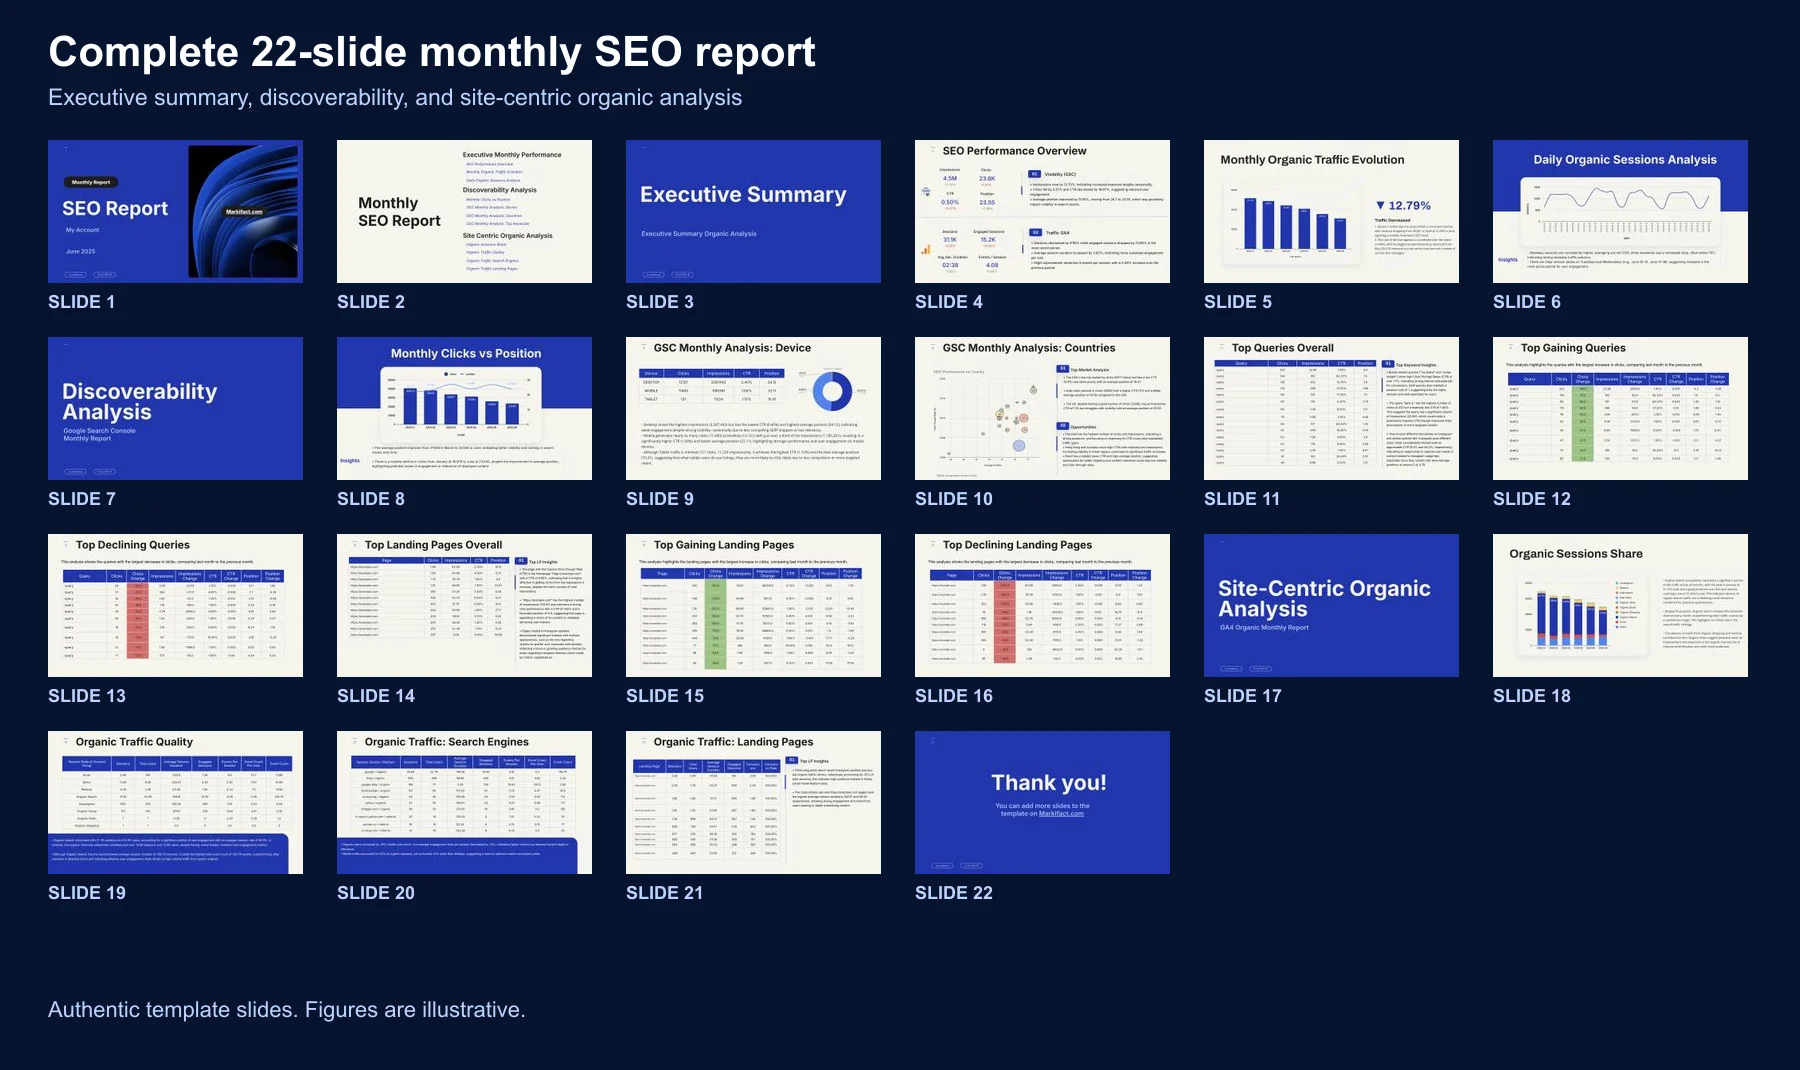
| Slides | Reporting chapter | What it explains |
|---|---|---|
| 1 to 2 | Cover and contents | Client, reporting month, and report navigation |
| 3 to 6 | Executive summary | GSC visibility, GA4 traffic, monthly organic evolution, and daily sessions |
| 7 to 16 | Discoverability analysis | Clicks versus position, devices, countries, queries, and Search Console landing pages |
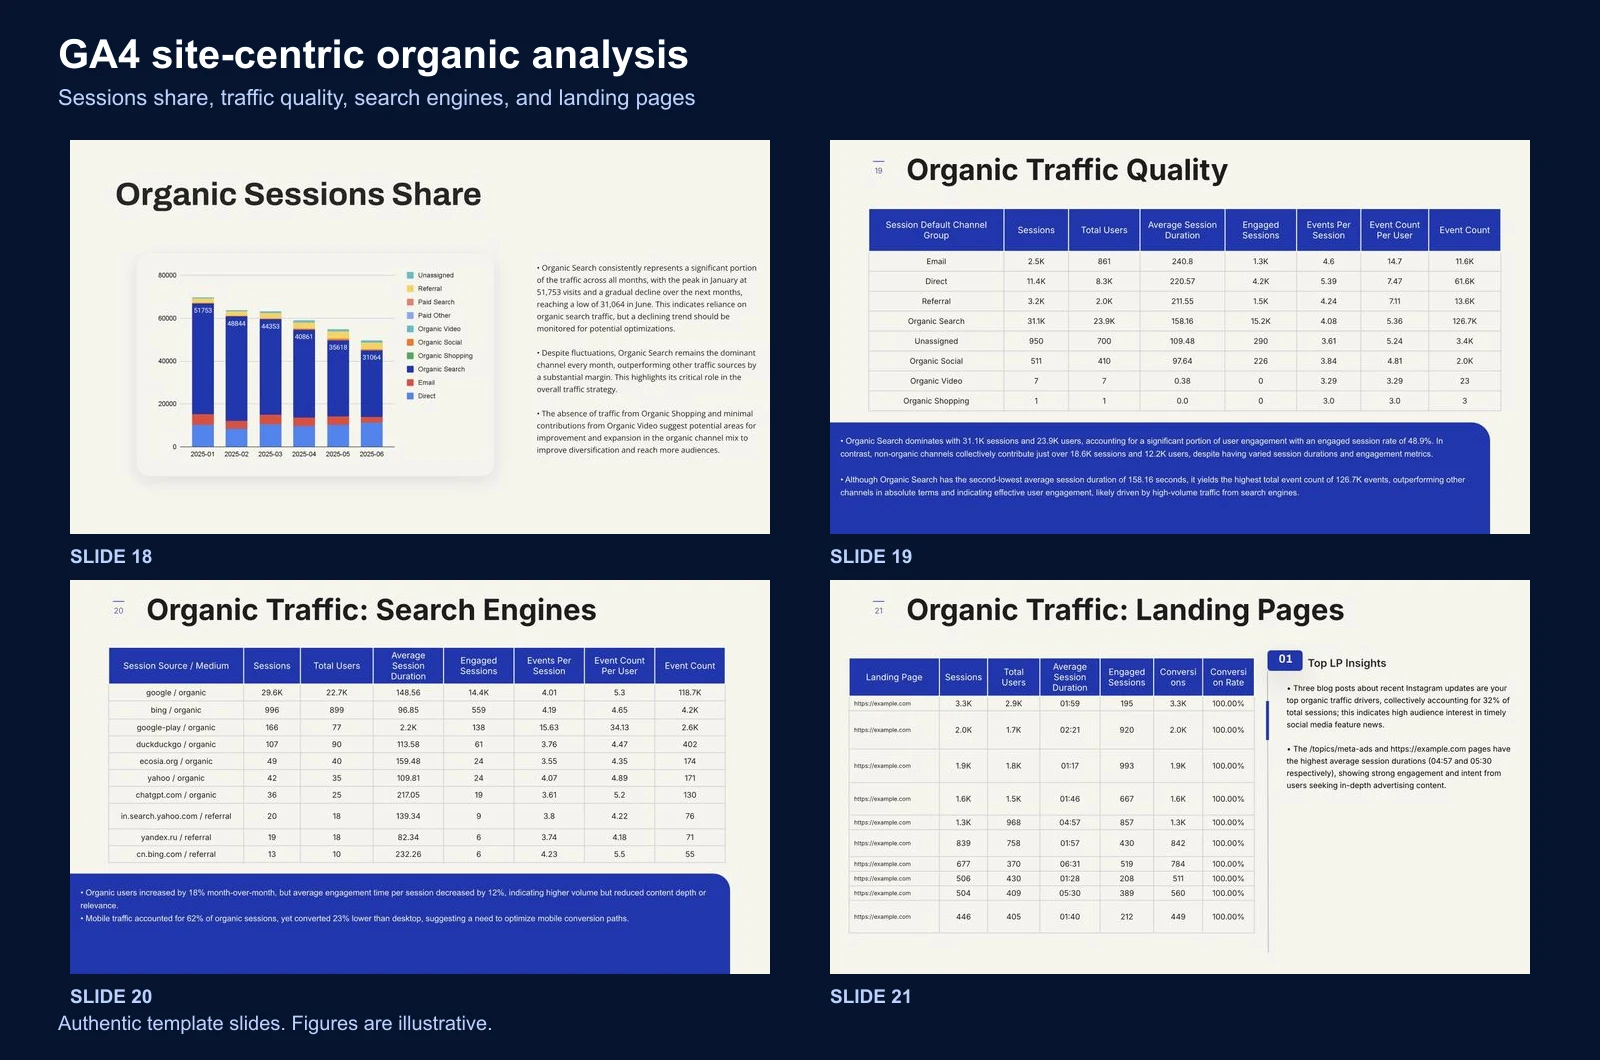
| 17 to 21 | Site-centric organic analysis | Organic traffic share, traffic quality, search engines, and GA4 landing pages |
| 22 | Close | Stable thank-you slide |
This stable structure is the core of the automation. The monthly run should update known reporting slots instead of rebuilding a presentation from an empty canvas.
Step 1: define the monthly reporting contract
Do not begin with “create my SEO report.” First define exactly what the report covers.
For most client reports, use one complete calendar month and one clearly labeled comparison. The previous complete calendar month is useful for operational movement. The same month in the previous year is useful when seasonality matters. Pick one primary comparison for the deck rather than switching the baseline from slide to slide.
Your reporting contract should include:
- Search Console property and GA4 property
- Exact current-period start and end dates
- Exact comparison-period start and end dates
- GA4 organic-search filter
- Search Console and GA4 metric definitions
- The key events that count as SEO outcomes
- Rules for missing values and zero denominators
- Client name and presentation
- Reviewer and approval boundary
Use this setup prompt with Claude:
Prepare the reporting contract for my monthly SEO report.

Before pulling data, state:
1. Search Console property
2. GA4 property
3. Current reporting start and end dates
4. Comparison start and end dates
5. GA4 filter used to isolate Organic Search
6. Search Console visibility metrics
7. GA4 engagement and key-event metrics
8. Rules for missing values and zero denominators
9. Google Slides presentation to update
10. Human reviewer for the final report

Do not pull data until I confirm the contract.
Keep Search Console clicks separate from GA4 sessions.
Do not change the website, tracking, content, or advertising.
If a source value is missing, display N/A. Do not silently replace missing data with zero. If the previous value is zero, show the absolute change and N/A for percentage change.
Step 2: connect Search Console and GA4 to Claude
Claude needs read-only access to both reporting sources. Markifact provides a Google Search Console MCP and a Google Analytics MCP for that purpose.
If Search Console is not connected yet, follow the step-by-step guide to connecting Google Search Console to Claude. Confirm that Claude can list the correct property before asking it to run a report. Do the same for the GA4 property.
Markifact's current reporting operations include gsc_get_report and ga4_get_report. Both can work with date ranges, dimensions, metrics, filters, comparisons, ordering, and selected properties. Treat these operation names as current examples, since the integration catalog can evolve.
The connection does not replace the reporting contract. Claude may have access to several properties, and choosing the wrong one can still produce a polished but incorrect deck.
Step 3: pull the Search Console visibility layer
Search Console should supply the visibility side of the story:
- Clicks
- Impressions
- CTR
- Average position
- Top queries
- Gaining and declining queries
- Top pages
- Gaining and declining pages
- Device and country breakdowns
Average position is not a fixed keyword rank. It is an average of the topmost position held by a result from the property or page for recorded impressions. Use it with click and impression movement instead of presenting it as a complete rank-tracking database.
Also remember that Search Console query data can be truncated or anonymized. The Search Analytics API does not guarantee every possible row. A top-query table is an evidence-rich reporting view, not a complete list of every search.
Use this prompt:
Use gsc_get_report for the confirmed Search Console property.

Run the confirmed complete calendar month and comparison period.
Return current values, comparison values, absolute changes, and
percentage changes for:
- clicks
- impressions
- CTR
- average position

Prepare separate tables for:
- date
- device
- country
- query
- page

For query and page, create three ranked views:
1. top overall
2. largest meaningful gains
3. largest meaningful declines

Keep source dates and the property in the output.
Show N/A for unavailable values.
If the prior value is zero, return the absolute change and N/A
for percentage change.
Do not infer causality.
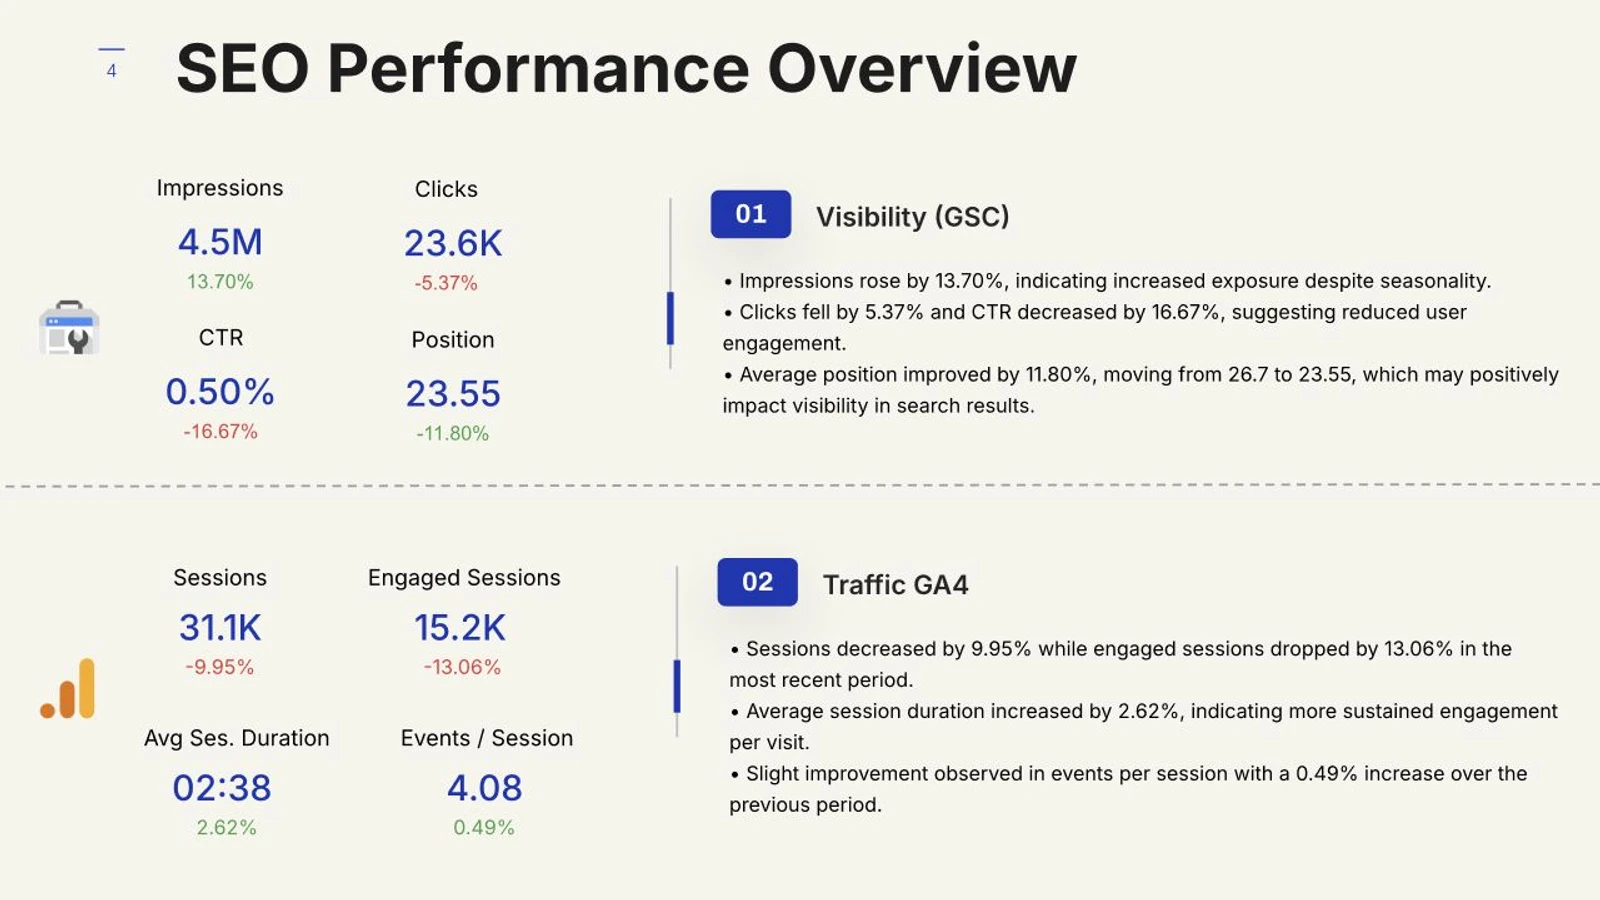
The overview slide should not collapse these two sources into one unexplained score. Its job is to let a stakeholder see the search-result movement and the onsite movement side by side.
Step 4: pull the GA4 organic-search layer
GA4 should answer what happened after visitors reached the site. Useful monthly metrics include:
- Sessions
- Active users
- Engaged sessions
- Average session duration
- Events per session
- Key events
- Session key event rate
- Ecommerce purchases or revenue, when relevant and approved
Filter GA4 to Organic Search before comparing it with Search Console. Confirm the key-event definition for the property before calling an event an SEO outcome.
Use ga4_get_report for the confirmed GA4 property.

Run the confirmed complete calendar month and comparison period.
Filter the report to Organic Search using a compatible GA4 dimension.

Return current values, comparison values, absolute changes, and
percentage changes for:
- sessions
- active users
- engaged sessions
- average session duration
- events per session
- key events
- session key event rate

Prepare separate reporting tables for:
- date
- session default channel group
- session source or medium
- landing page

Preserve the property, date ranges, filter, and metric names.
Do not equate GA4 sessions with Search Console clicks.
Do not label key events as conversions until I confirm their definition.
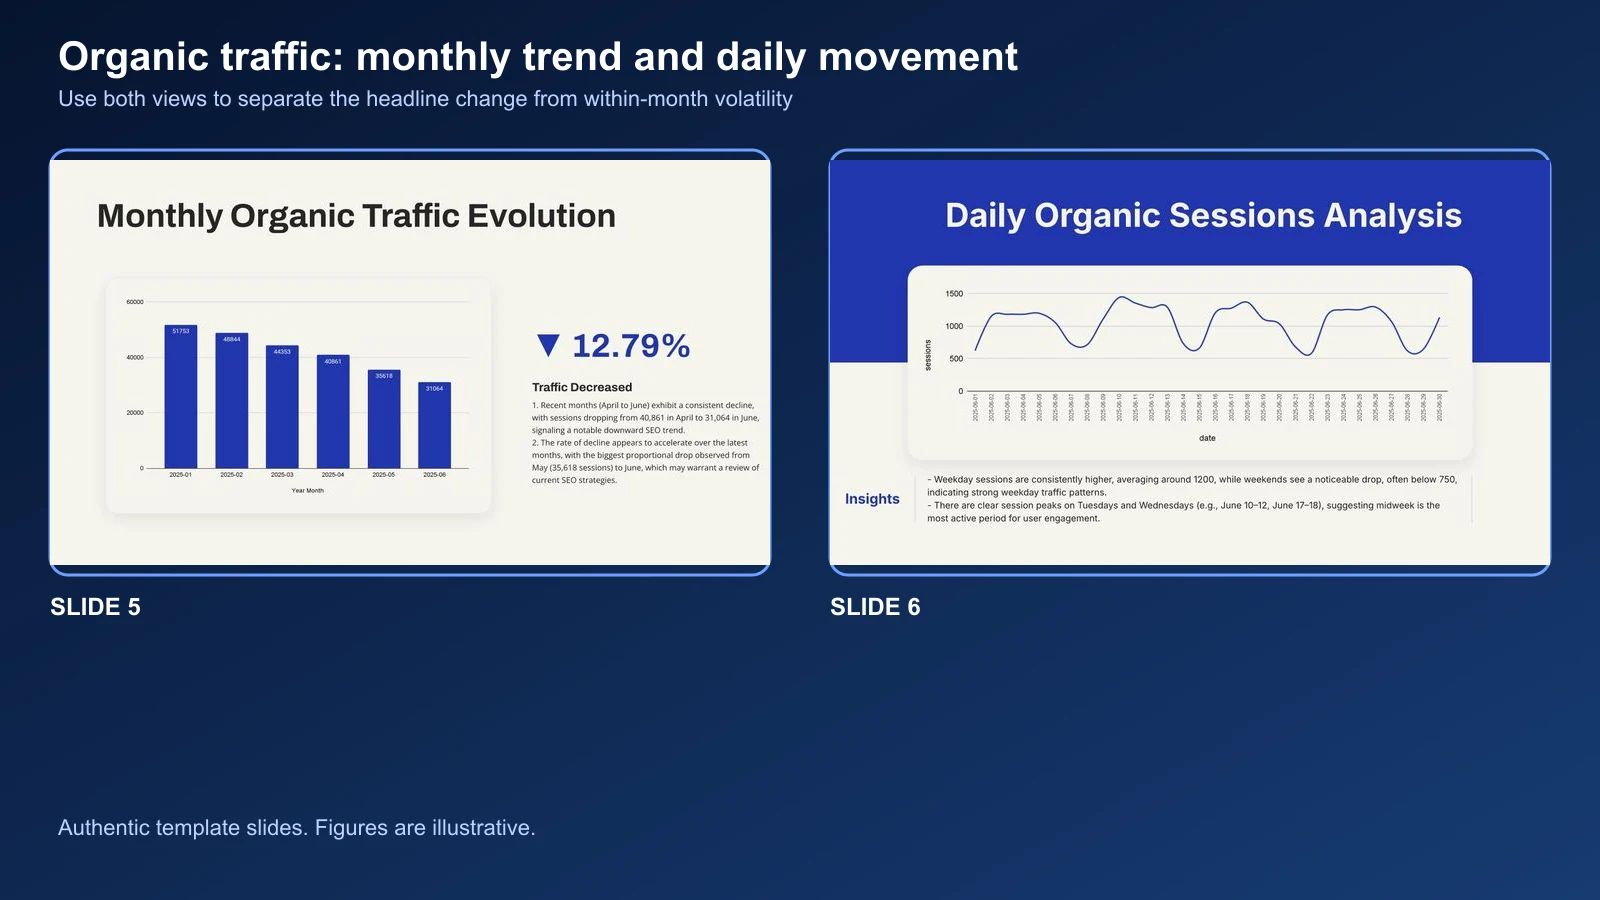
A monthly total can hide tracking interruptions, campaigns, news events, or site incidents. The daily view provides a useful QA surface before Claude writes the executive summary.
Step 5: calculate changes before Claude writes
The reporting layer, not the language model, should calculate monthly changes:
absolute_change = current_value - comparison_value
percentage_change = ((current_value - comparison_value) / comparison_value) * 100
When the comparison value is zero, percentage change is not useful. Show the absolute change and N/A for the percentage. Apply consistent rounding after the calculation, not before it.
Keep metric direction separate from judgment. More impressions can be positive, but not if they come from irrelevant queries. A lower average position number can be positive, but the number needs click and impression context. More organic sessions can be positive, but the traffic-quality metrics determine whether those visits were useful.
Step 6: build the discoverability chapter
Slides 8 to 10 explain where visibility changed before the report moves into individual queries and pages.
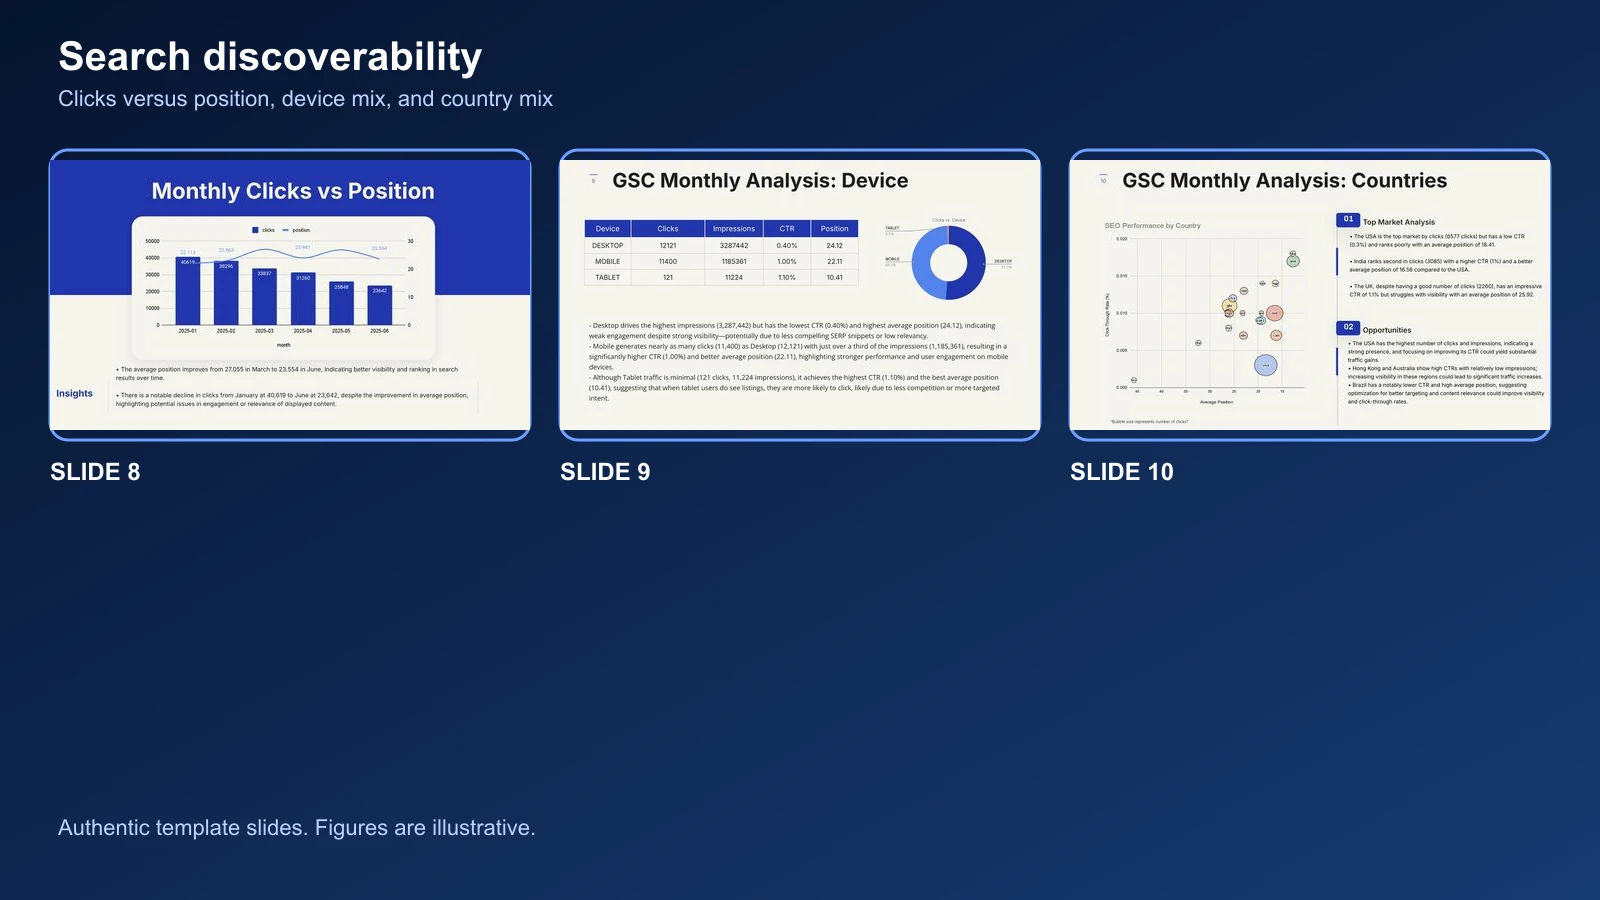
The clicks-versus-position slide should show both metrics without implying that position alone caused the click movement. Device and country views can reveal mix changes that affect CTR, demand, and onsite behavior.
Use a simple evidence rule: every highlighted change should be traceable to a visible metric, dimension, date window, and comparison.
Step 7: find the queries that explain the month
One “top queries” table is not enough. It is usually dominated by established terms, so it may hide the movements that matter this month.
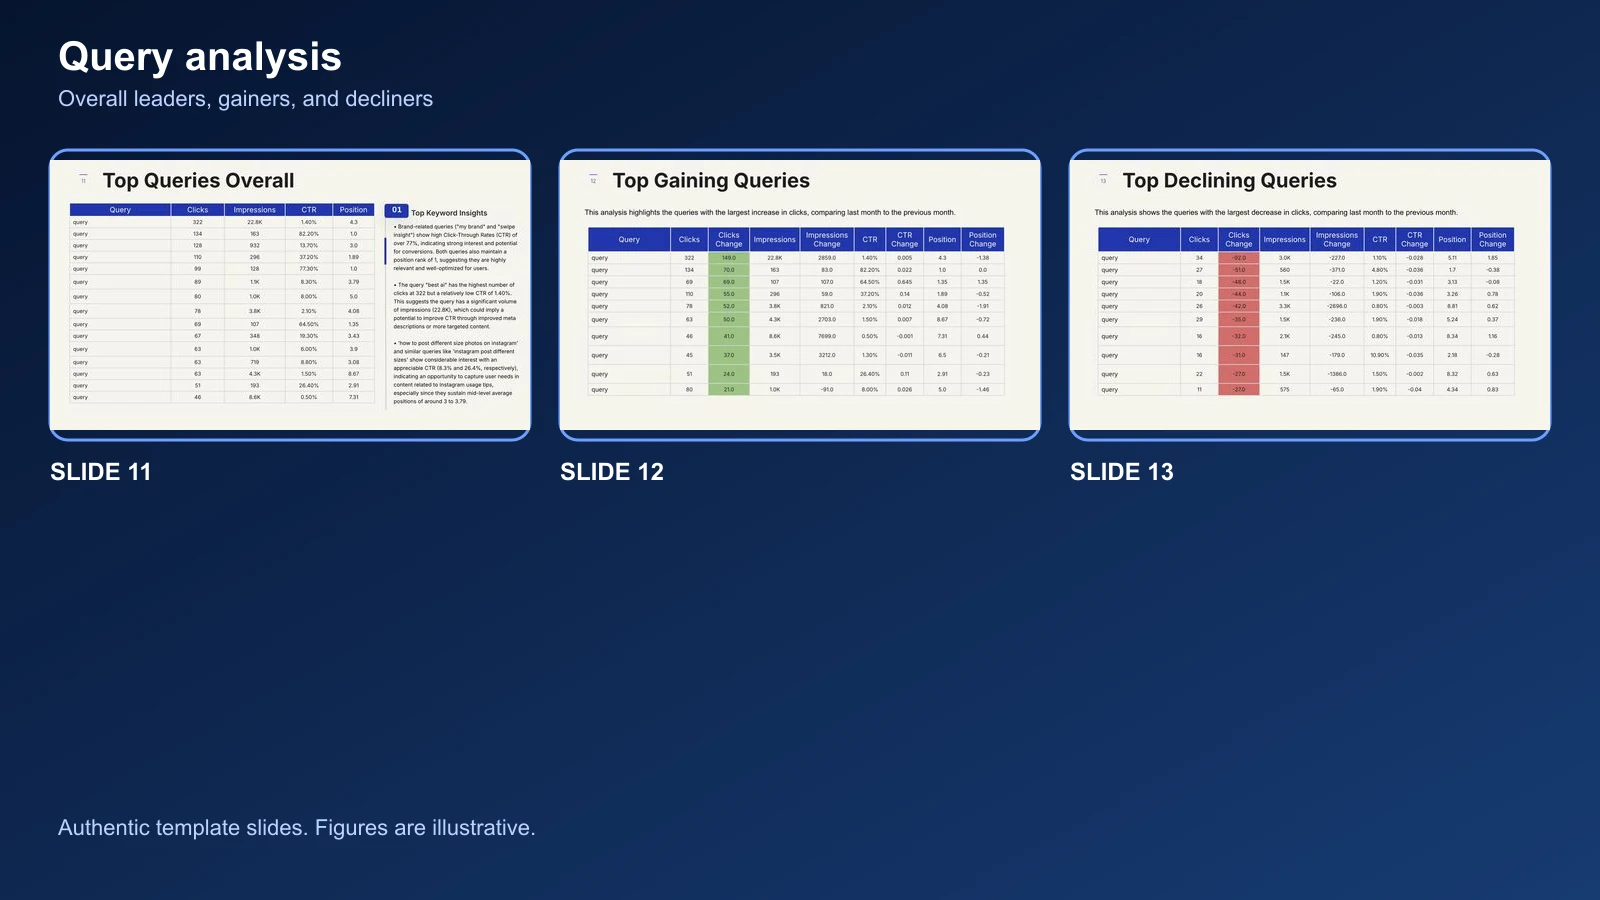
Create three views:
- Top overall queries show the largest current contributors.
- Gaining queries show meaningful positive changes in clicks, impressions, CTR, or position.
- Declining queries show meaningful negative changes that deserve investigation.
Avoid ranking rows only by percentage change. A move from one impression to three impressions is a 200% increase, but it may not deserve space in a client report. Add minimum-volume thresholds or combine percentage and absolute movement.
Ask Claude to produce observations, not explanations, from this table:
Review the supplied Search Console query tables.

Write:
- two observations about the largest current contributors
- two observations about meaningful gains
- two observations about meaningful declines

Every observation must name the query, metric, current value,
comparison value, and calculated change.
Do not claim why a query moved unless evidence is supplied.
Flag brand terms separately from non-brand terms when the classification
is available. Do not guess the classification.
Step 8: connect Search Console pages to GA4 landing pages
Search Console page reporting and GA4 landing-page reporting answer different questions. Search Console shows how pages performed in Google Search. GA4 shows what happened in recorded sessions after a landing page visit.
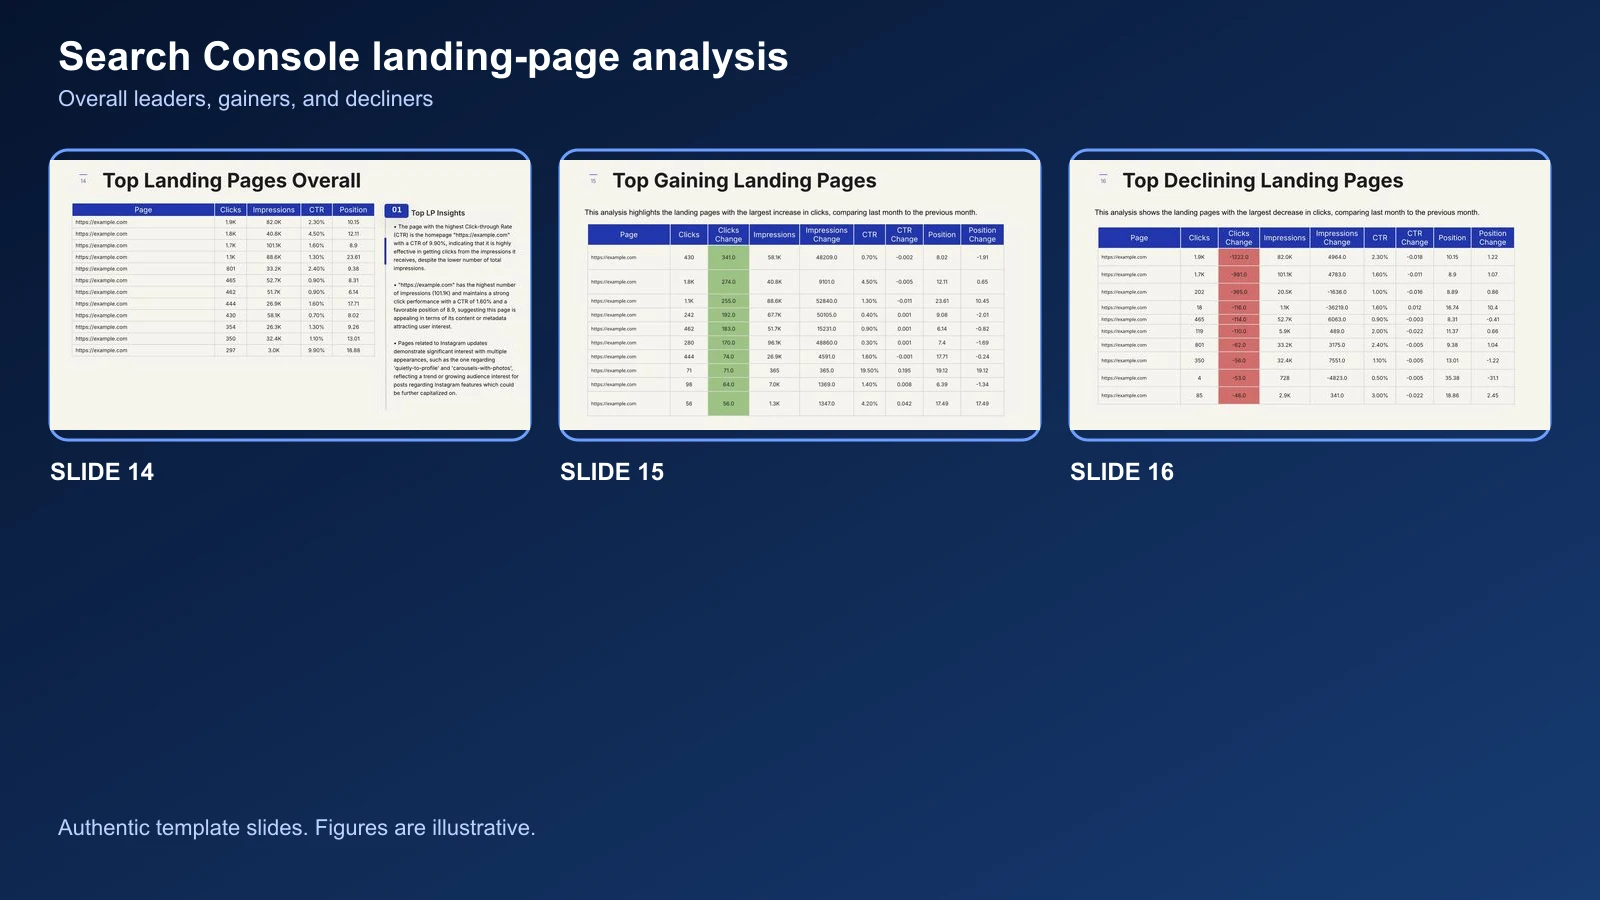
Do not join the two sources by title. Use normalized URLs and account for canonicalization, parameters, trailing slashes, hostname variants, and path changes. Google generally credits page-level Search Console data to its selected canonical URL.
Useful page-level checks include:
- Impressions rose, but CTR fell
- Clicks rose, but engaged sessions did not
- Sessions rose, but key events fell
- Search visibility declined after a URL change
- A small set of pages explains most of the monthly change
These are investigation patterns, not automatic diagnoses. A discrepancy can come from attribution, consent, tracking, canonicalization, date boundaries, or normal user behavior.
Step 9: write the narrative in three evidence layers
Claude should receive prepared tables and calculated comparisons. It should not repair the source data or invent missing context.
Use three explicit layers:
- Observed fact: what the verified values show
- Interpretation: what the pattern may mean
- Recommended action: what a person should inspect or approve next
Write the monthly SEO report narrative from the supplied verified tables.

Rules:
- Do not change, recompute, or invent any value.
- Separate observed facts, interpretations, and recommended actions.
- Every observed fact must cite the metric, current value,
  comparison value, and calculated change.
- Use causal language only when the supplied evidence proves causality.
- Otherwise use "may", "could", or "needs investigation".
- Mention incomplete, missing, anonymized, or incompatible data.
- Keep Search Console clicks separate from GA4 sessions.
- Do not recommend publishing content, changing tracking, or modifying
  the site without human approval.

Produce:
1. three concise executive observations
2. two interpretations
3. three prioritized next checks
4. one data-quality note
This structure makes the final copy easier to audit. If the evidence changes, you can update the observation without rewriting an unsupported story around it.
Step 10: update Google Slides with stable identifiers
The presentation should expose stable targets for every automated update. Alt-text identifiers are more resilient than instructions such as “change the third box on slide 4.”
The inspected template includes identifiers for fields such as:
impressions
impressionsPercentage
clicks
clicksPercentage
ctr
ctrPercentage
position
positionPercentage
sessions
sessionsPercentage
engagedSessions
engagedSessionsPercentage
averageSessionDuration
eventsPerSession
Current Markifact examples include slides_replace_text for text updates and slides_update_table for structured table content. Prefer targeting elements by alt text. Use slides_create_presentation when the workflow needs to create a new presentation from the approved source.
Use this update prompt:
Update the confirmed Google Slides presentation from the approved
reporting tables and narrative.

Rules:
- Target text, tables, and charts by stable alt-text identifiers.
- Use slides_replace_text for mapped text updates.
- Use slides_update_table for structured table updates.
- Preserve the approved layout, fonts, colors, and slide order.
- Show N/A for missing values.
- Do not add a percentage when the comparison denominator is zero.
- Do not overwrite the source template.
- Stop and report any missing or duplicate identifier.
- Do not share, export, or distribute the deck.

Return a change log containing slide number, identifier, old value,
new value, and source table.
The last instruction creates an audit trail. It also prevents a silent layout issue from becoming a client-facing error.
Step 11: run the human QA and approval gate
Automation can assemble the report. It should not be the final approver.
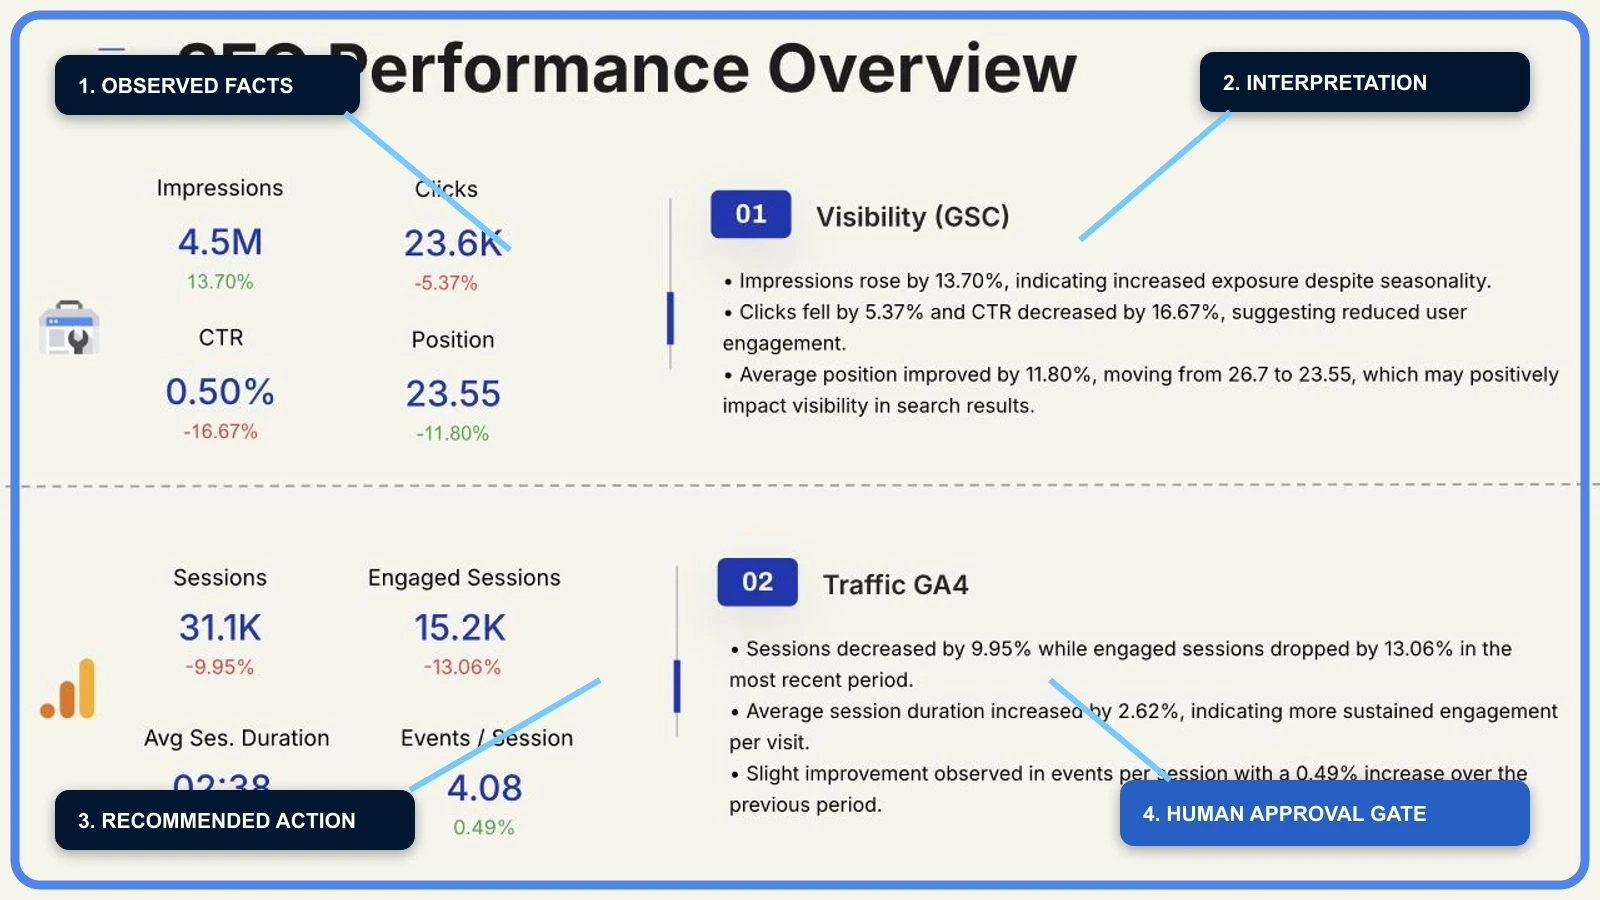
Use this checklist before distribution:
- Correct Search Console and GA4 properties
- Complete current and comparison periods
- Correct GA4 Organic Search filter
- Confirmed key-event definitions
- Search Console clicks kept separate from GA4 sessions
- Missing values displayed as
N/A - Zero denominators handled without invented percentages
- Totals reconcile with supporting tables
- Query and page tables use meaningful volume thresholds
- Charts match their source rows, dates, units, and sorting
- Every observed fact is visible in the approved data
- Interpretations use appropriately cautious language
- Recommendations stay within the reporting scope
- Google Slides identifiers updated the intended objects
- Client name, reporting period, and source labels are correct
- Account owner approves the final deck
Only after this review should a person share the presentation, export a PDF, or present the findings.
Reuse the workflow every month
Once the contract, tables, and alt-text identifiers are stable, the recurring process becomes short:
- Select the new complete month.
- Confirm the comparison period.
- Reconfirm the Search Console and GA4 properties.
- Review key-event or tracking-definition changes.
- Run the reporting workflow.
- Inspect the data and slide change log.
- Complete the QA gate.
- Approve and distribute the report.
Scheduling can start the workflow, but it should not bypass approval. The automation is authorized to read reporting data and prepare a presentation. It is not authorized to publish content, change tracking, edit the website, or send the report to a client unless a person explicitly approves those actions.
If you want the exact report architecture shown here, copy the Monthly SEO Performance Slides template and adapt the reporting contract to your properties and client.
Frequently asked questions
What should a monthly SEO report include?
A monthly SEO report should include a clearly defined period and comparison, Search Console visibility metrics, GA4 organic-traffic outcomes, query and page movement, a concise evidence-based narrative, and approved next actions. It should also state data limitations and metric definitions.
Can Claude automate an SEO report?
Yes. Claude can pull read-only reporting data through connected tools, organize tables, draft insights, and update a Slides presentation. A human should still confirm the properties, dates, filters, calculations, claims, and recommendations before distribution.
Should I combine Search Console clicks and GA4 sessions?
No. Display them together when useful, but keep them as separate metrics. Search Console clicks measure activity on Google Search results, while GA4 sessions measure recorded visits on the site.
How do I compare one month with another?
Use complete calendar months with explicit dates and one consistent comparison. Calculate absolute and percentage changes before narrative generation. If the prior value is zero, show the absolute change and N/A for the percentage.
How do I update Google Slides without breaking the design?
Target text boxes, tables, and other elements with stable alt-text identifiers or unique placeholders. Preserve the template layout and stop the workflow when an identifier is missing or duplicated instead of guessing which object to update.
Is the monthly SEO report template free?
The current template page provides the reusable Google Slides report and workflow details. Check the Monthly SEO Performance Slides template page for the latest access and usage information.