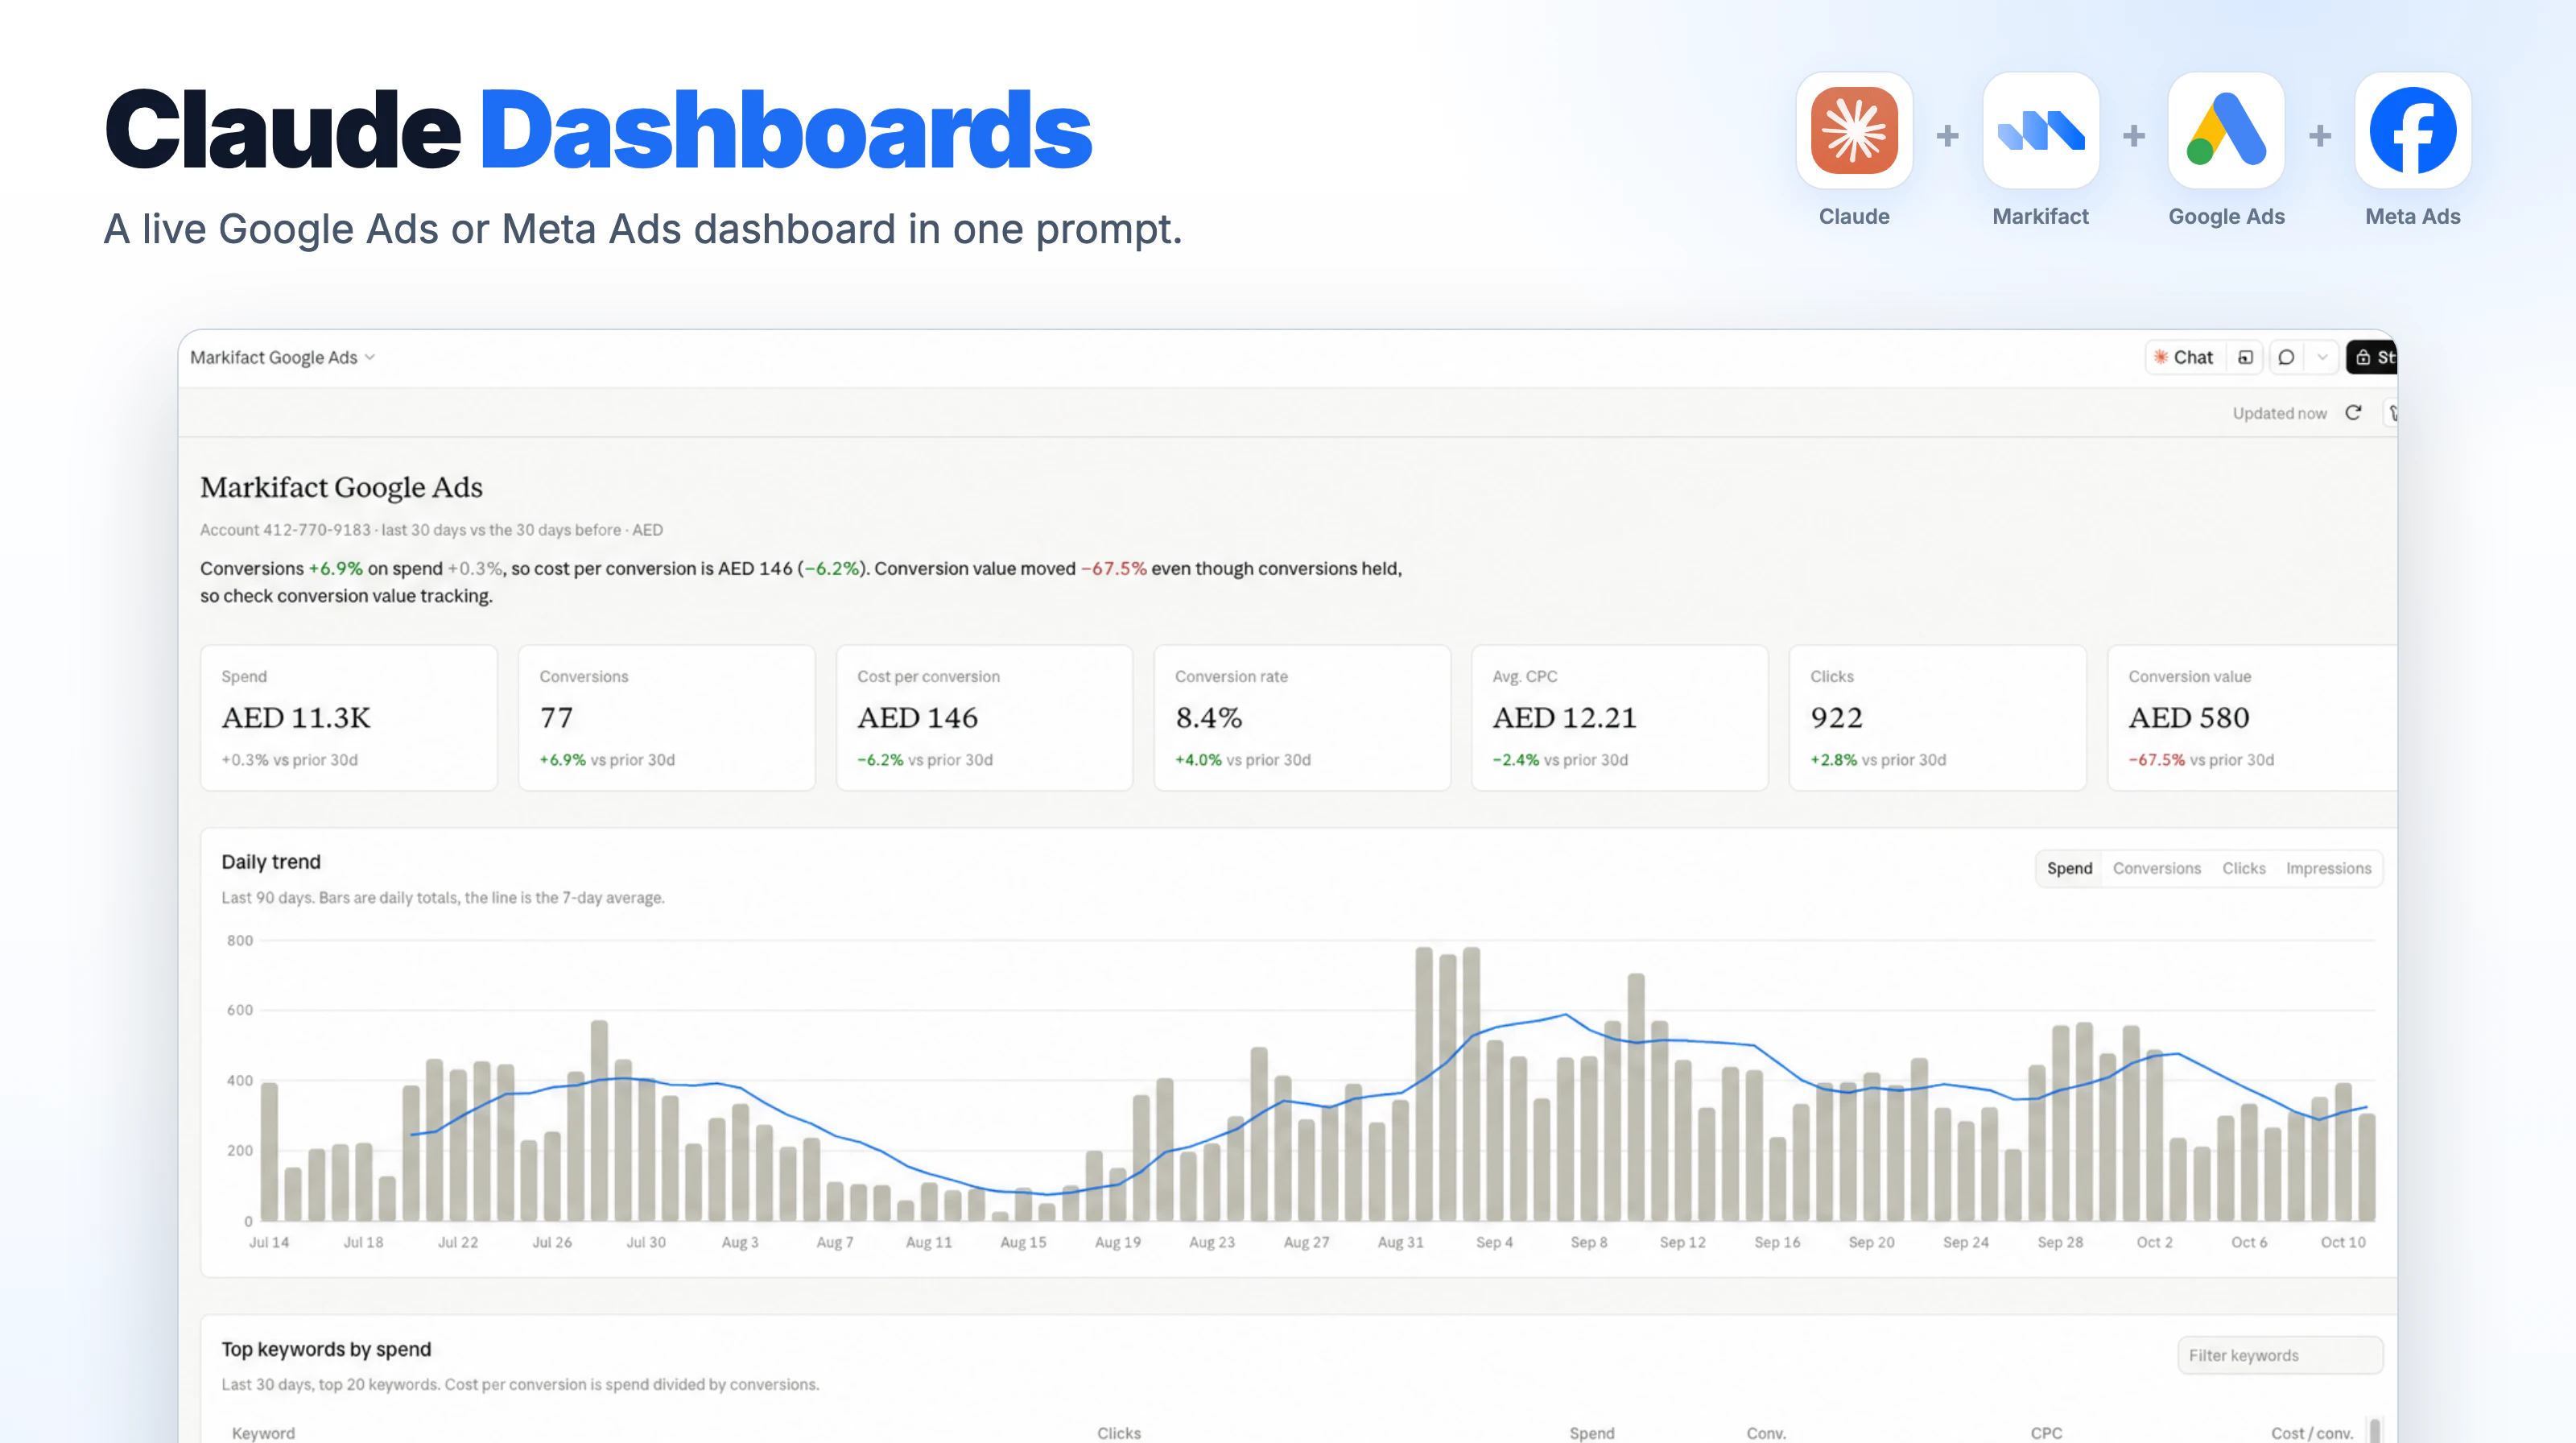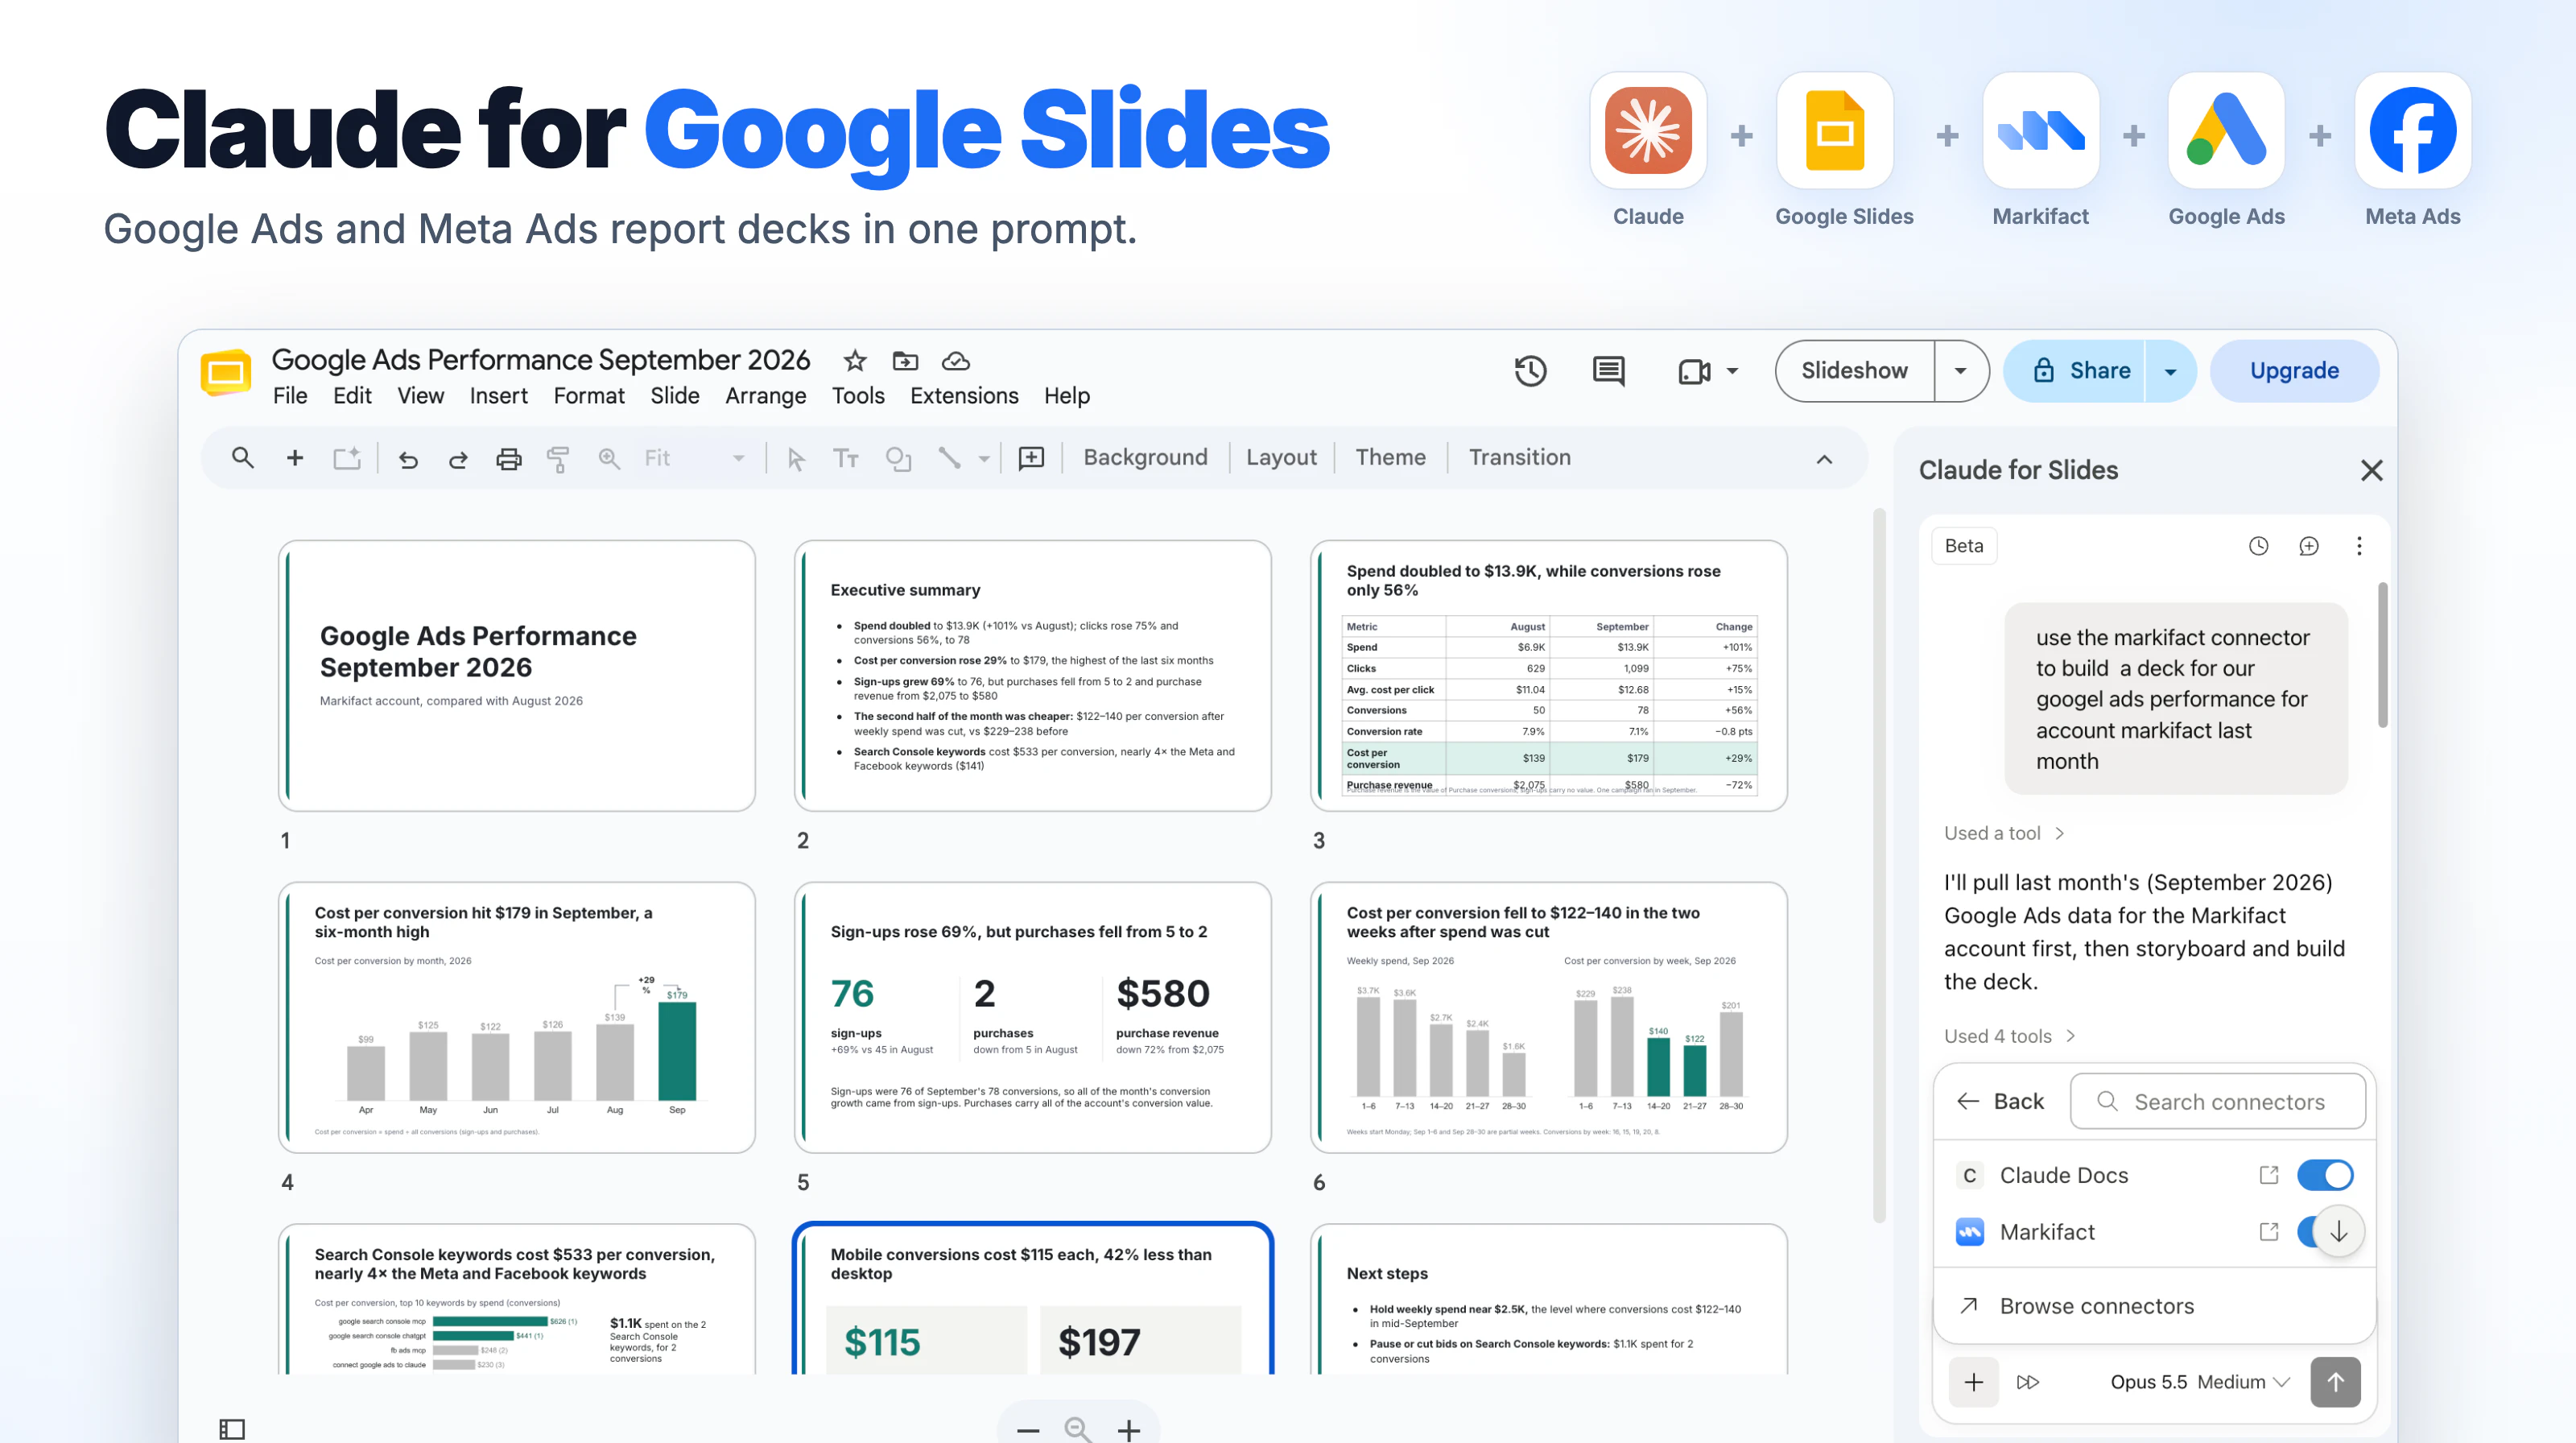


You can automate Google and Meta Ads monthly reports by locking a data contract, pulling the current and previous periods from both platforms, normalizing the metrics in Google Sheets, generating evidence-linked insights, and populating a branded Google Slides template. The point is not to let AI improvise a client story. It is to remove repetitive report construction while keeping the account, currency, timezone, conversion definitions, and final recommendations under human review. This workflow recipe shows how an 18-slide deck can build its combined, Google Ads, and Meta Ads sections automatically every month.
How the monthly client report builds itself
A reliable automated PPC reporting workflow has five layers:
- Google Ads and Meta Ads provide the source metrics.
- A reporting contract defines the exact accounts, dates, currencies, outcomes, and attribution rules.
- Google Sheets becomes the structured chart-data layer.
- AI analyzes only the normalized numbers and calculated changes.
- Google Slides receives the KPI cards, tables, charts, and draft narrative.
This separation matters. If AI is asked to pull data, reconcile metrics, calculate deltas, decide what happened, and write the final story in one step, it becomes difficult to see where an error entered the report. A structured workflow makes every layer inspectable.
The live Google and Meta Ads monthly report template already connects those layers. You copy the supplied Sheets and Slides files, select the two ad accounts, choose the reporting period, and run the workflow. The rest of this guide explains the contract that makes that automation trustworthy.
What the 18-slide report covers
The deck uses stable cover, divider, and closing slides around three reporting sections.
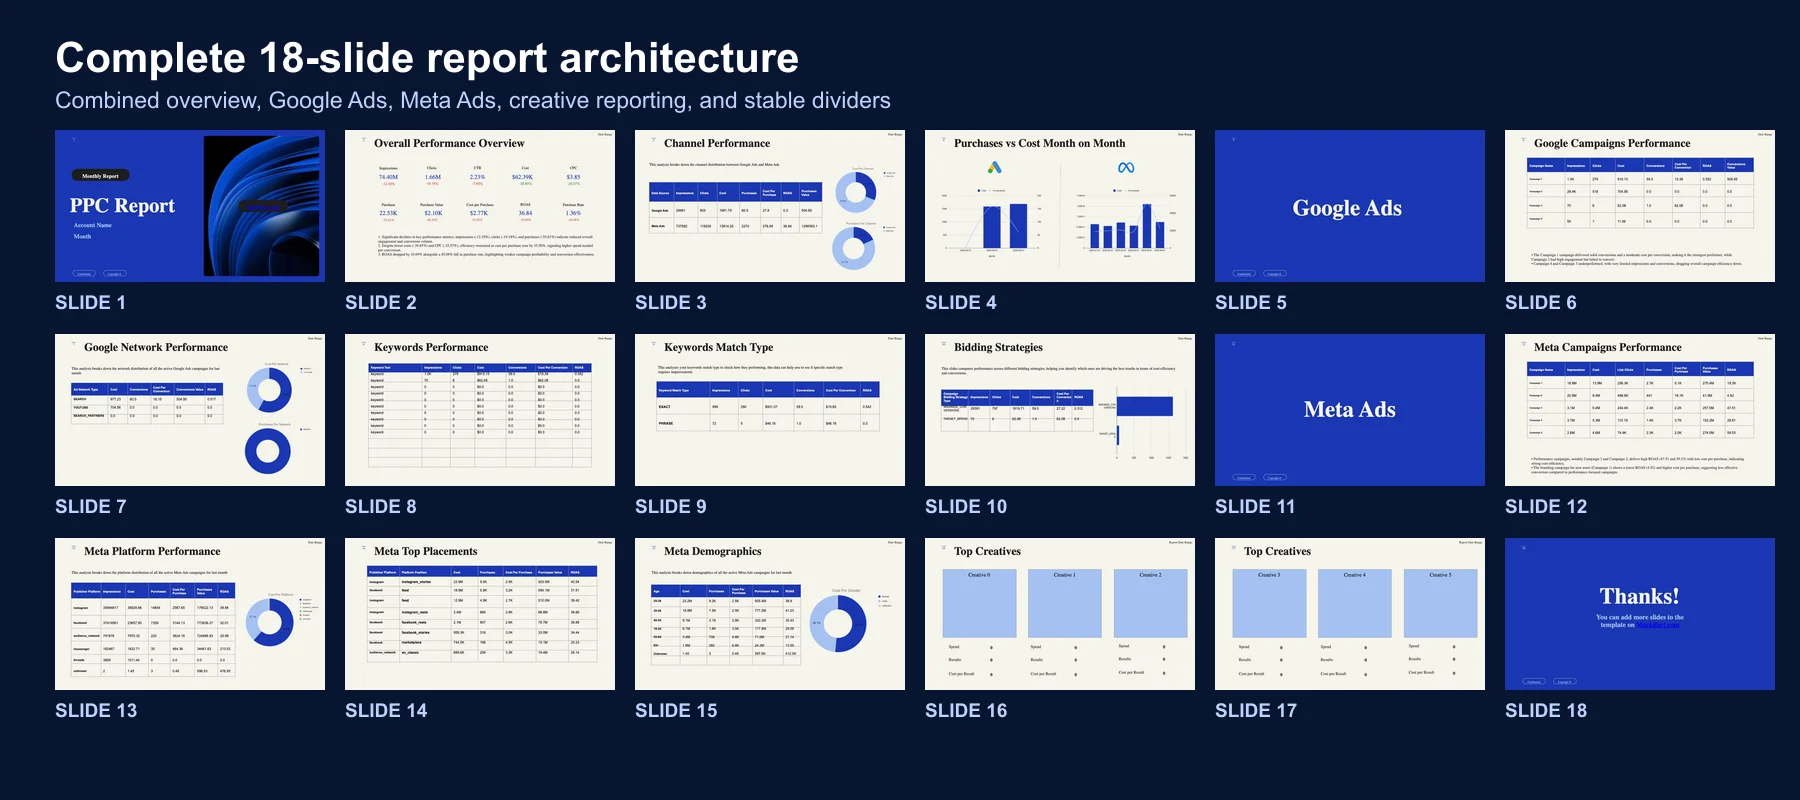
| Slides | Section | Main output |
|---|---|---|
| 1, 5, 11, 18 | Cover, dividers, close | Stable presentation structure |
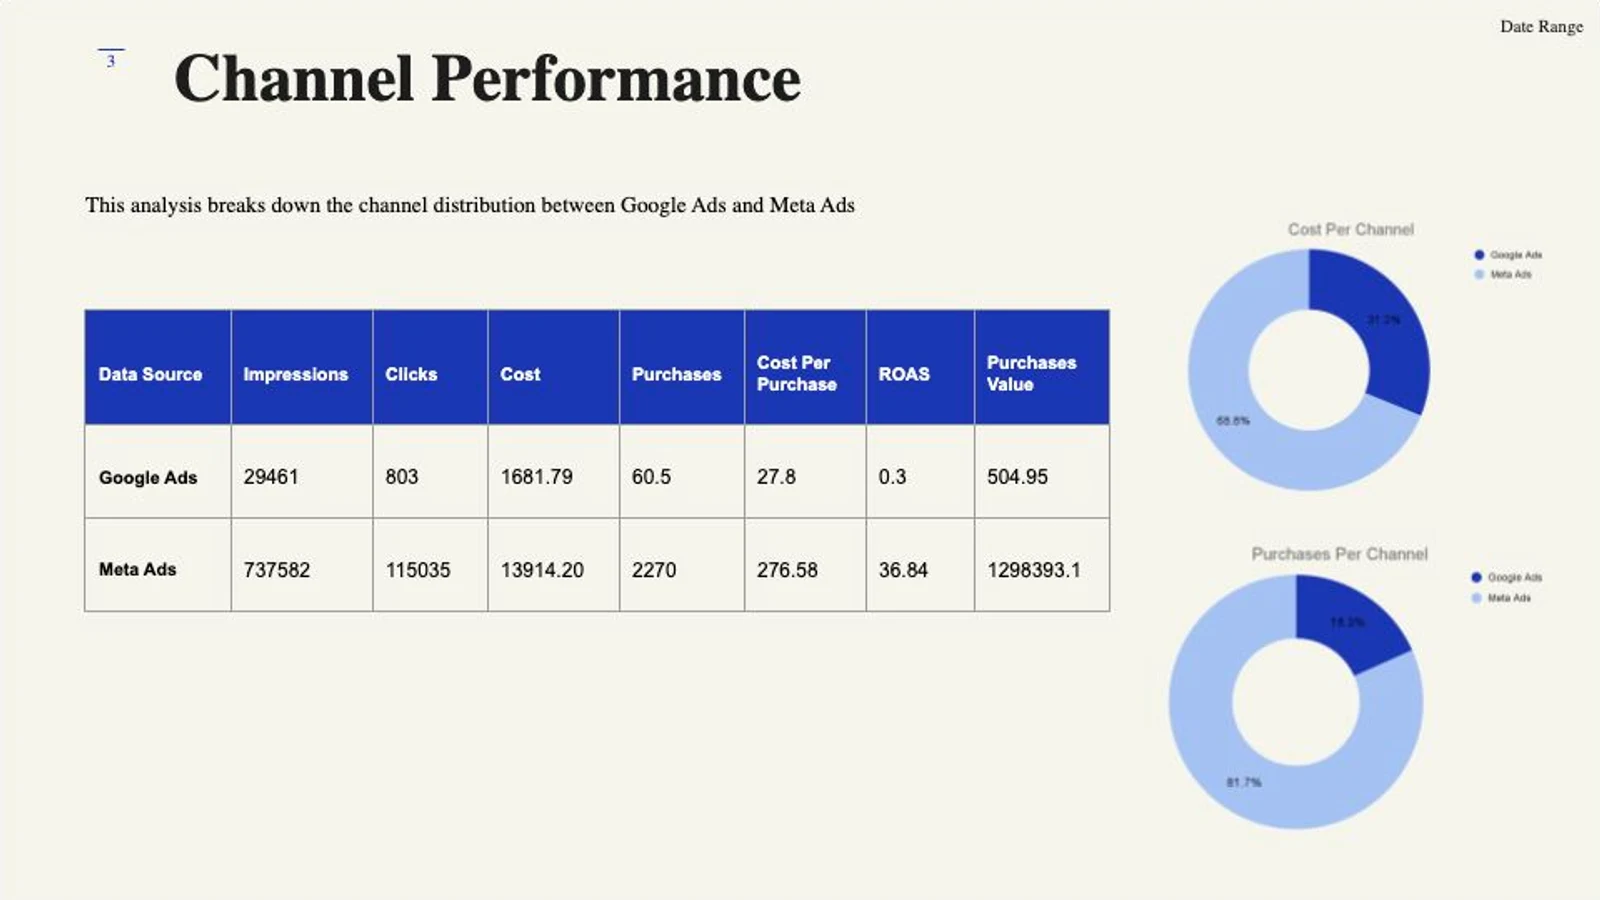
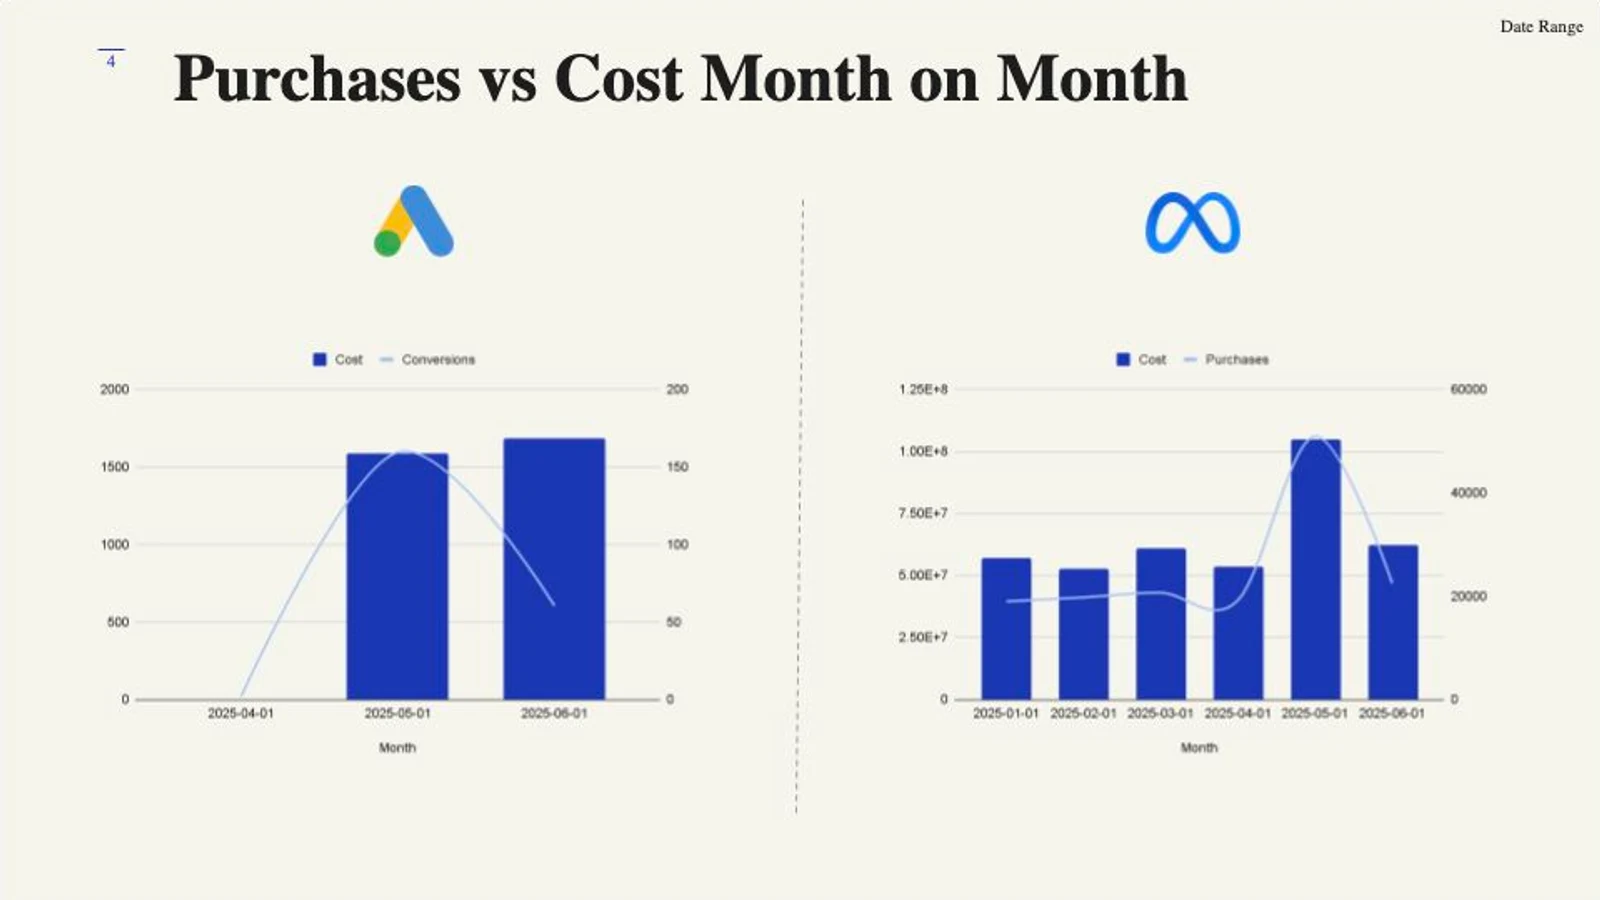
| 2 to 4 | Combined performance | Executive KPIs, channel comparison, monthly trends |
| 6 to 10 | Google Ads | Campaigns, networks, keywords, match types, bidding strategies |
| 12 to 17 | Meta Ads | Campaigns, platforms, placements, demographics, creatives |
The architecture is deliberately repeatable. You are not rebuilding a presentation each month. You are updating a known set of reporting slots.
Step 1: define the reporting contract
Do not start with “build my monthly report.” Start with the exact definitions that the workflow must preserve.
Your contract should state:
- Google Ads customer and Meta Ads account
- Current reporting period and comparison period
- Timezone used to decide when a day or month starts and ends
- Currency for each account and the rule for any currency conversion
- Google conversion action or goal used as the outcome
- Meta purchase or result event used as the outcome
- Attribution setting used for the Meta report
- Whether the report covers completed calendar months or a month-to-date period
- How missing values and zero denominators should appear
Use this setup prompt:
Prepare the data contract for my Google and Meta Ads monthly report.

Before running a report, state:
1. Google Ads customer name and ID
2. Meta Ads account name and ID
3. Account currency and timezone for each platform
4. Current reporting dates and comparison dates
5. Exact Google conversion definition
6. Exact Meta purchase or result definition
7. Meta attribution setting
8. Rules for missing values, zero denominators, and currency conversion

Do not pull data until I confirm that contract.
Do not treat unlike conversion events as one total.
This is the most important approval boundary in the workflow. A human must confirm the contract before any combined KPI is accepted.
Step 2: pull both periods from each platform
Pull the current and comparison periods with the same fields and the same account scope. For a completed monthly report, compare one full calendar month with the full calendar month immediately before it. For a month-to-date report, compare equivalent day counts and label that choice clearly.
In Markifact, gads_get_report and meta_ads_get_report are the normal reporting operations. They support dates, comparison settings, metrics, dimensions, filters, sorting, and selected accounts. These are examples, not the limit of Markifact's reporting catalog.
Use Markifact to prepare the source tables for a completed monthly report.

For Google Ads, call gads_get_report for the confirmed customer.
For Meta Ads, call meta_ads_get_report for the confirmed account.

Use the current complete calendar month and the previous complete calendar
month from the approved data contract. Return current values, comparison
values, absolute changes, and percentage changes.

Build only the levels needed by the deck:
- combined channel totals
- campaign
- Google network, keyword, match type, and bidding strategy
- Meta platform, placement, age, gender, and creative

Keep source identifiers and date ranges in the output.
Flag unavailable fields instead of estimating them.
Do not make any advertising changes.
Google Ads reporting supports account-to-keyword performance data and explicit date ranges. Meta's Insights API supports reporting fields and compatible breakdowns. The practical rule is simple: use one explicit period definition for both platforms and retain each platform's source labels until normalization is complete.
Step 3: normalize Google and Meta metrics
Cross-channel reporting fails when similar labels are assumed to mean the same thing.
| Report metric | Google Ads source | Meta Ads source | Contract rule |
|---|---|---|---|
| Spend | Cost | Spend | Same currency unit |
| Impressions | Impressions | Impressions | Can be summed |
| Clicks | Approved click field | Approved click field | State the click definition |
| Outcome | Conversions | Purchases or approved result | Same business event only |
| Outcome value | Conversion value | Purchase value | Same event and currency |
| Efficiency | CPA and ROAS | Cost per purchase and ROAS | Use approved outcome |
Never silently add Google conversions to Meta purchases. First confirm that both represent the same business outcome. If Google counts qualified leads while Meta counts purchases, keep them separate.
Use these calculation rules:
spend = normalized account-currency cost
outcomes = approved Google conversions or approved Meta purchases
cost_per_outcome = spend / outcomes
roas = approved outcome value / spend
ctr = approved clicks / impressions
If a denominator is zero or a metric is unavailable, return N/A. Do not replace missing data with zero. A zero means the platform reported none. Missing means the workflow does not have a valid value.
Step 4: calculate monthly comparisons
Calculate changes before AI sees the data.
absolute_change = current - previous
percentage_change = ((current - previous) / previous) * 100
When the previous value is zero, show the absolute change and N/A for percentage change. A jump from zero to ten purchases is real, but calling it an infinite percentage increase is not useful client reporting.
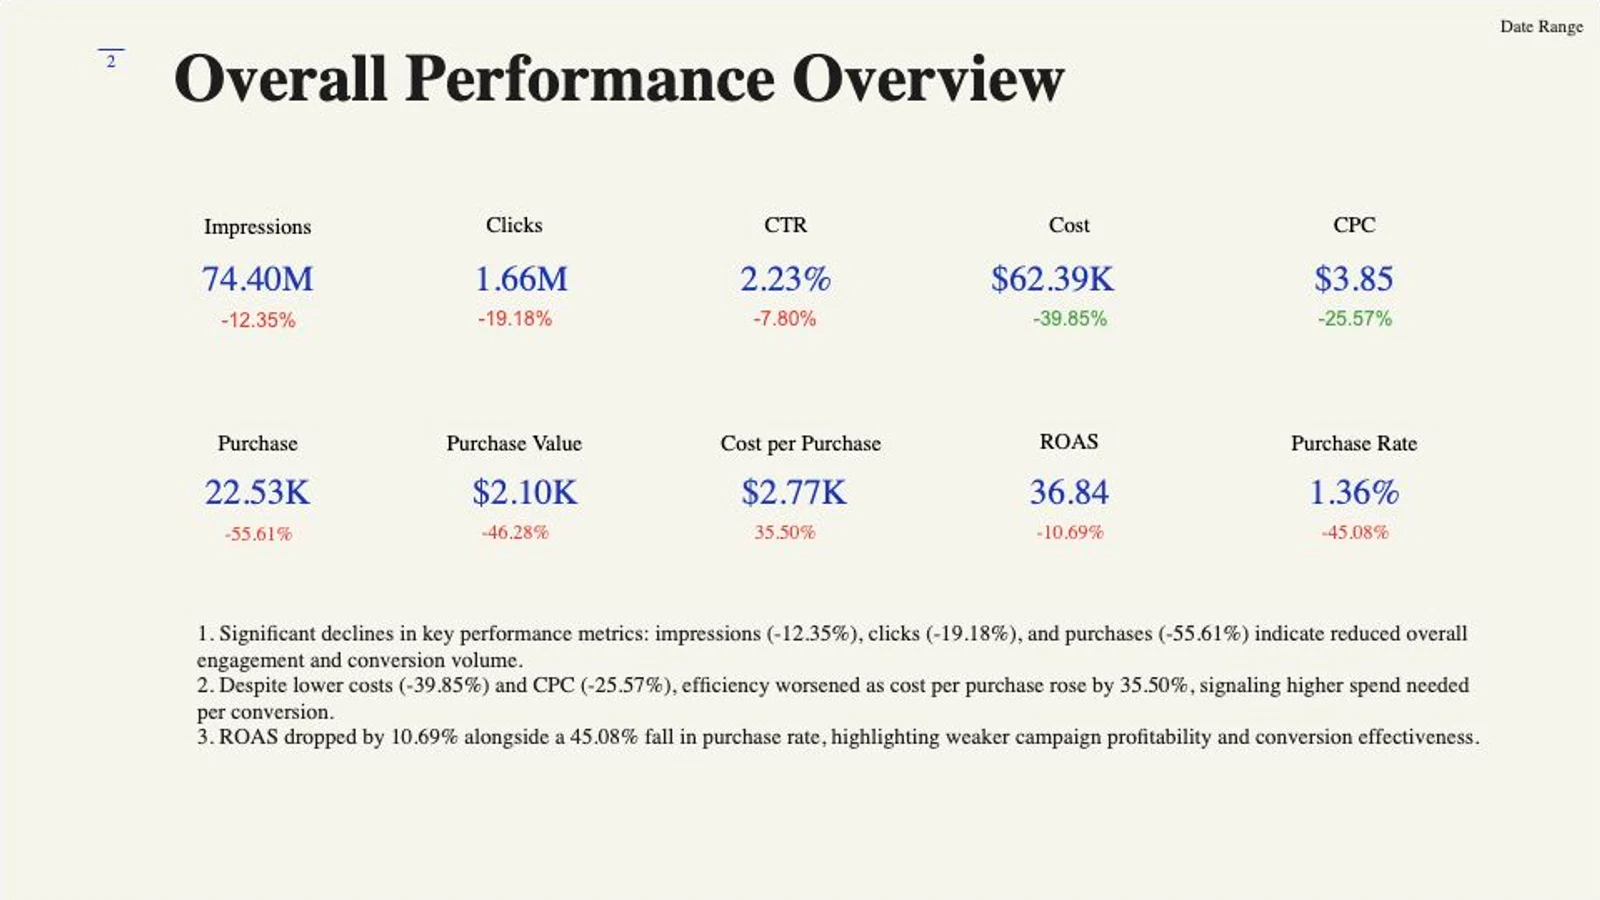
Also separate direction from judgment. Lower spend is not automatically good. Higher cost per purchase is usually undesirable, while higher purchase value may be positive. The model should receive both the metric type and the calculated change, not just a green or red color.
Step 5: generate grounded AI insights
AI should interpret a prepared table, not repair the source data. Give it current values, comparison values, calculated deltas, definitions, and flags.
Use this prompt:
Write the monthly paid media insights from the supplied normalized tables.

Rules:
- Do not change, recompute, or invent a value.
- Put observed facts, interpretations, and recommendations in separate sections.
- Every observation must name the metric, current value, previous value,
  and calculated change that supports it.
- Describe causality only when the supplied evidence proves it.
- Otherwise use "may", "could", or "needs investigation".
- Mention missing data, attribution differences, and incomplete periods.
- Produce three concise executive bullets and one next-check list.
- Do not recommend a live advertising change without human review.
The output should distinguish:
- Fact: Meta purchases fell 18% while spend fell 4%.
- Interpretation: efficiency weakened because cost per purchase increased.
- Recommendation: inspect the campaign and placement breakdowns before changing budget.
That format makes the narrative auditable.
Step 6: populate the Google reporting sections
The Google Ads section maps prepared reporting tables into campaigns, networks, keywords, match types, and bidding strategies.
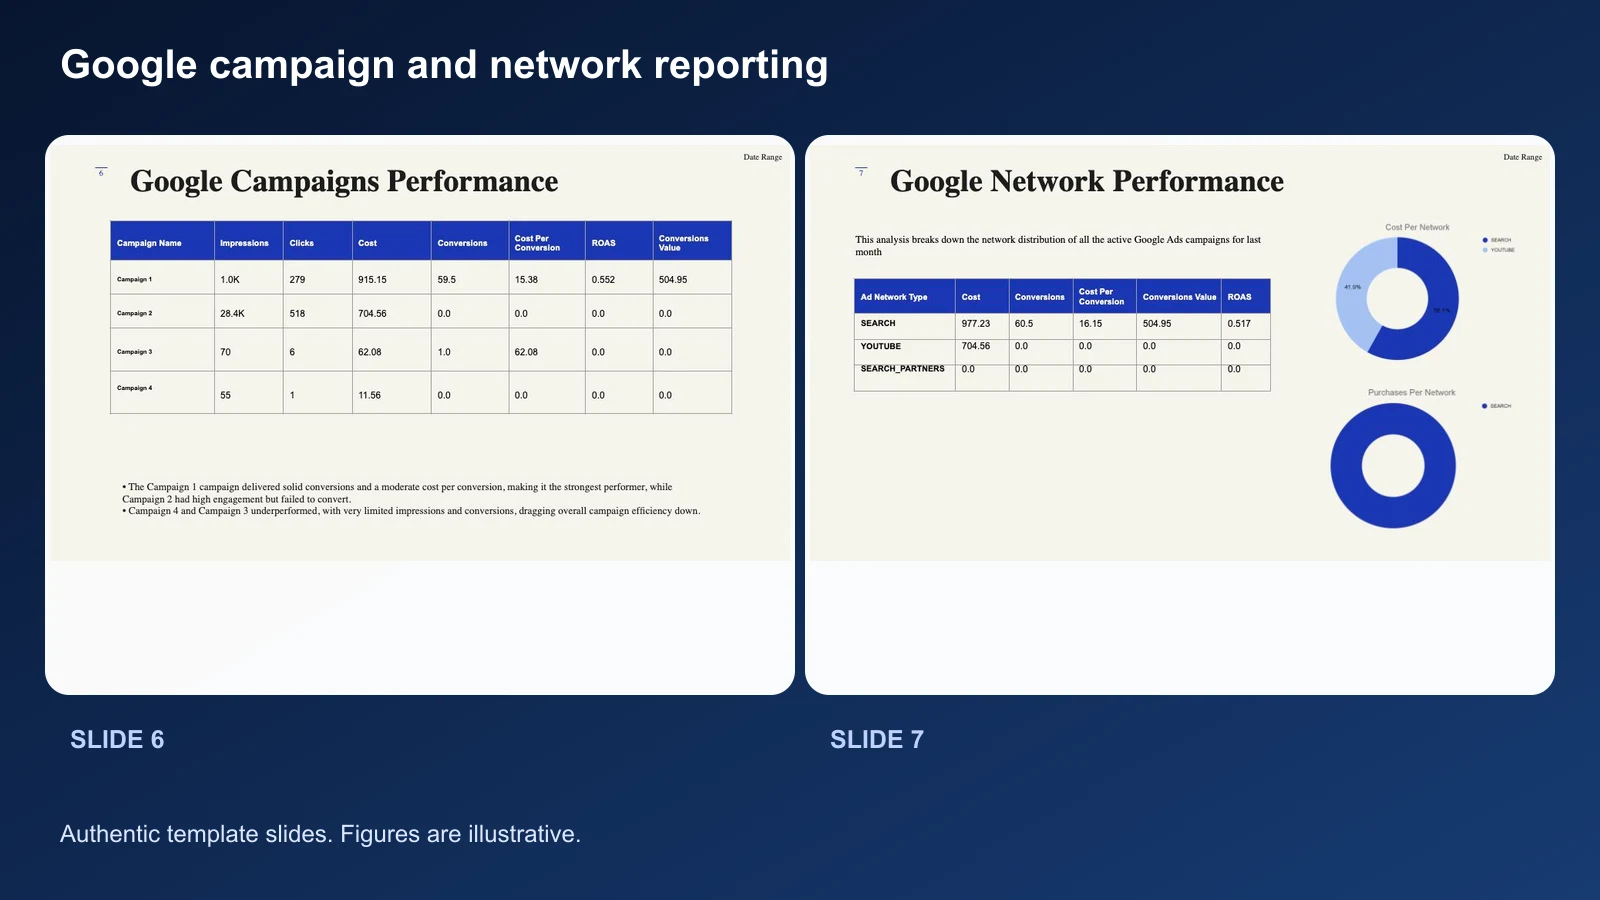
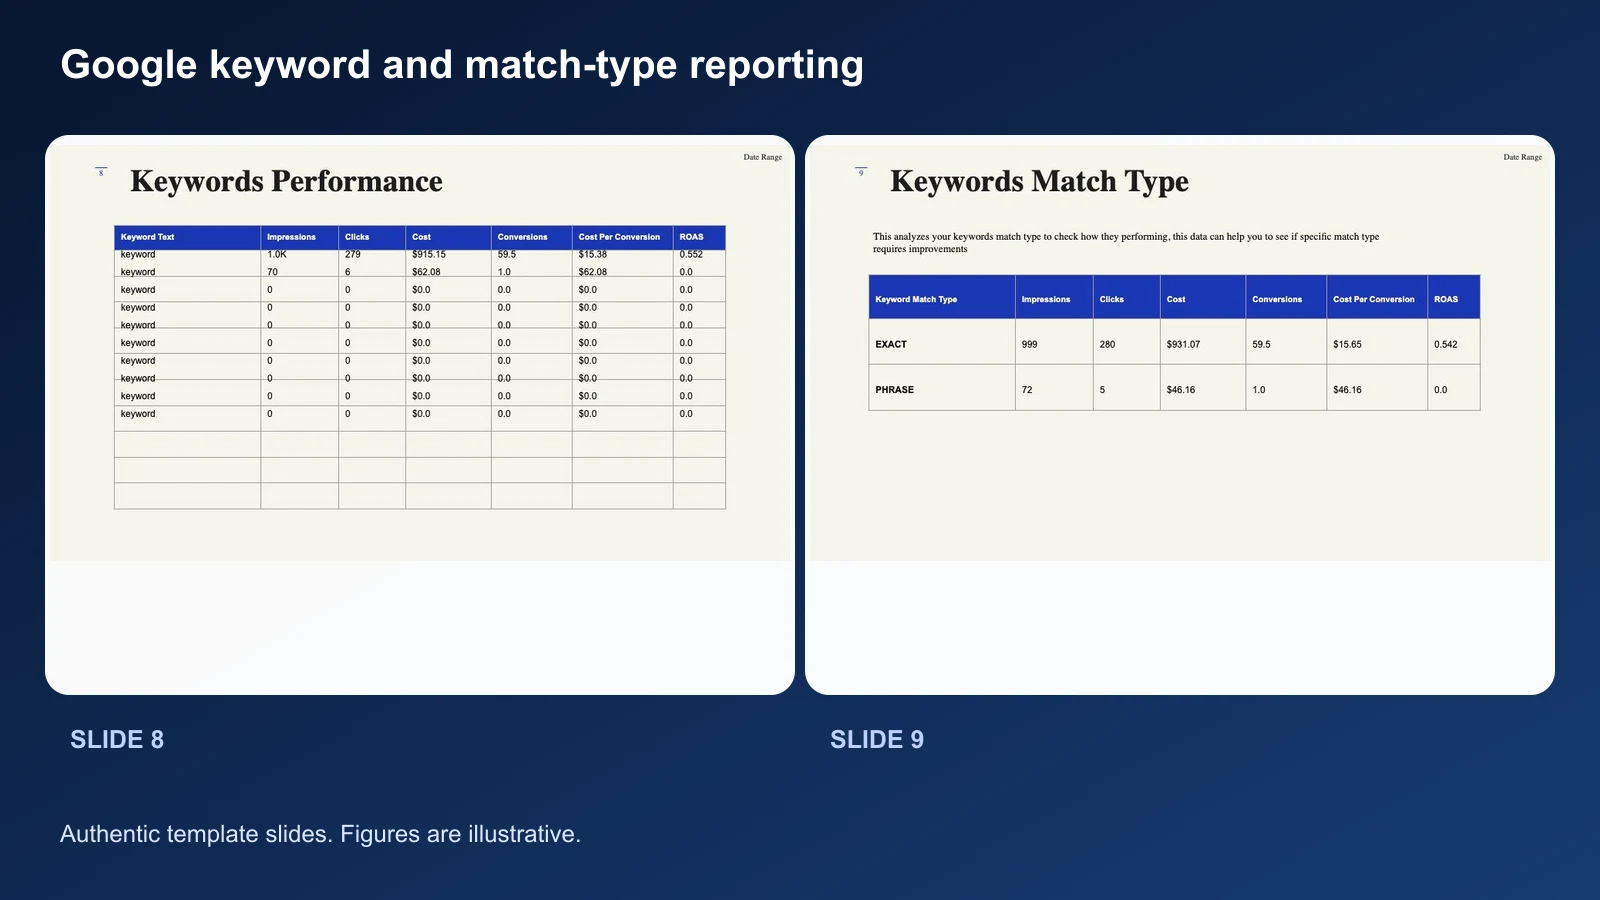
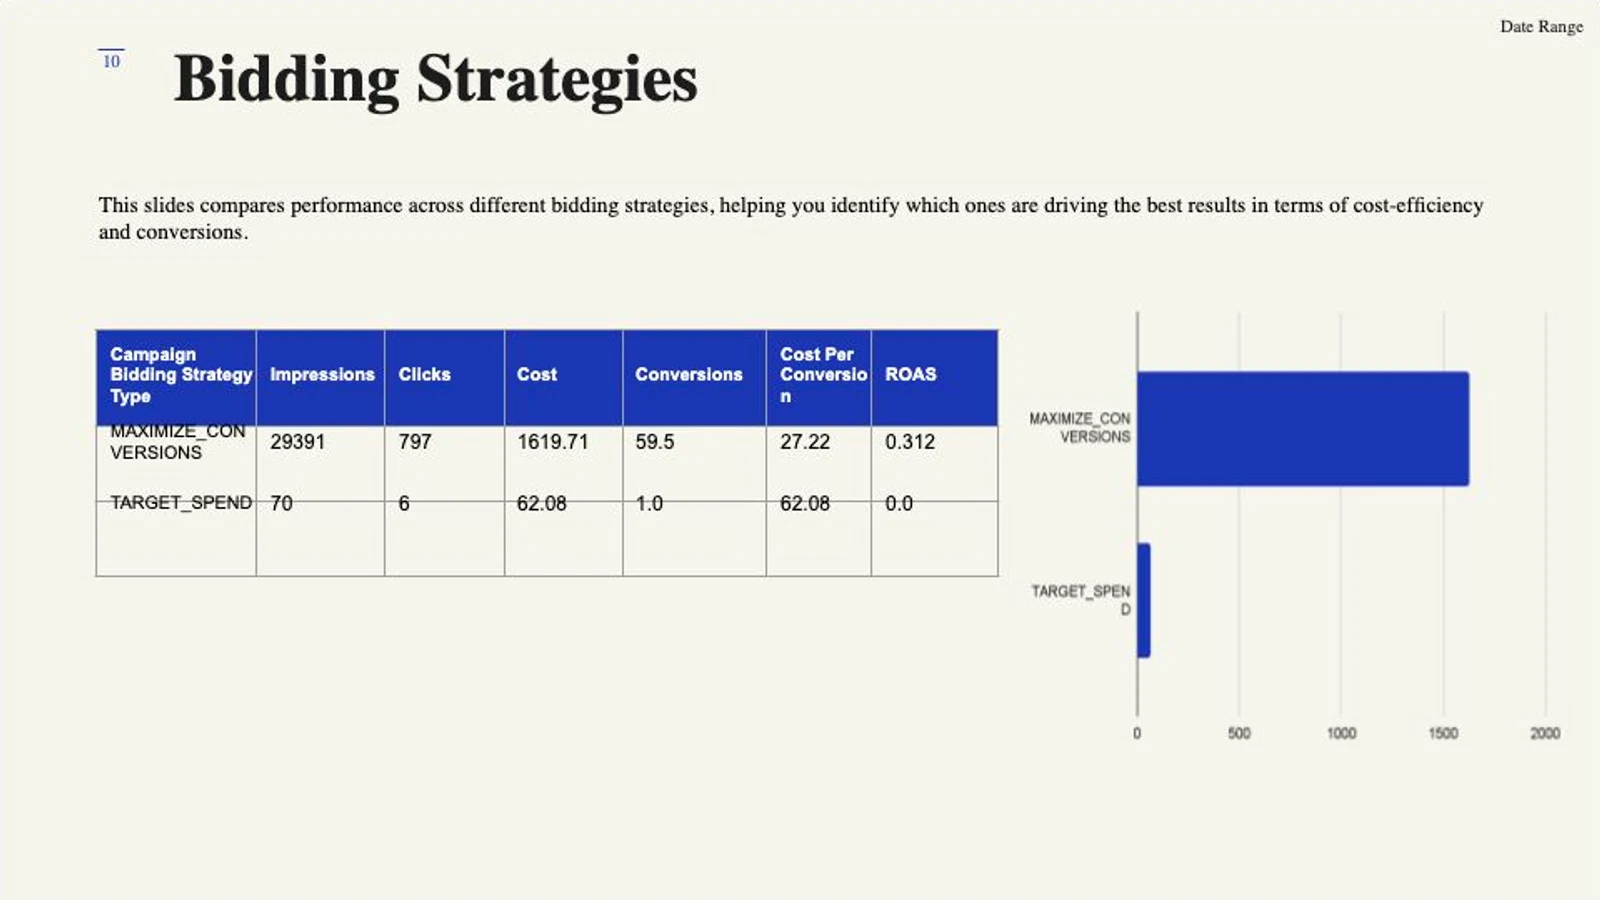
Do not force a diagnosis from one table. A campaign that lost conversions may need a network, keyword, search-term, bidding, or measurement check. The deck gives the client a concise view, while the underlying Sheets tables preserve the detail needed for follow-up.
Step 7: populate the Meta reporting sections
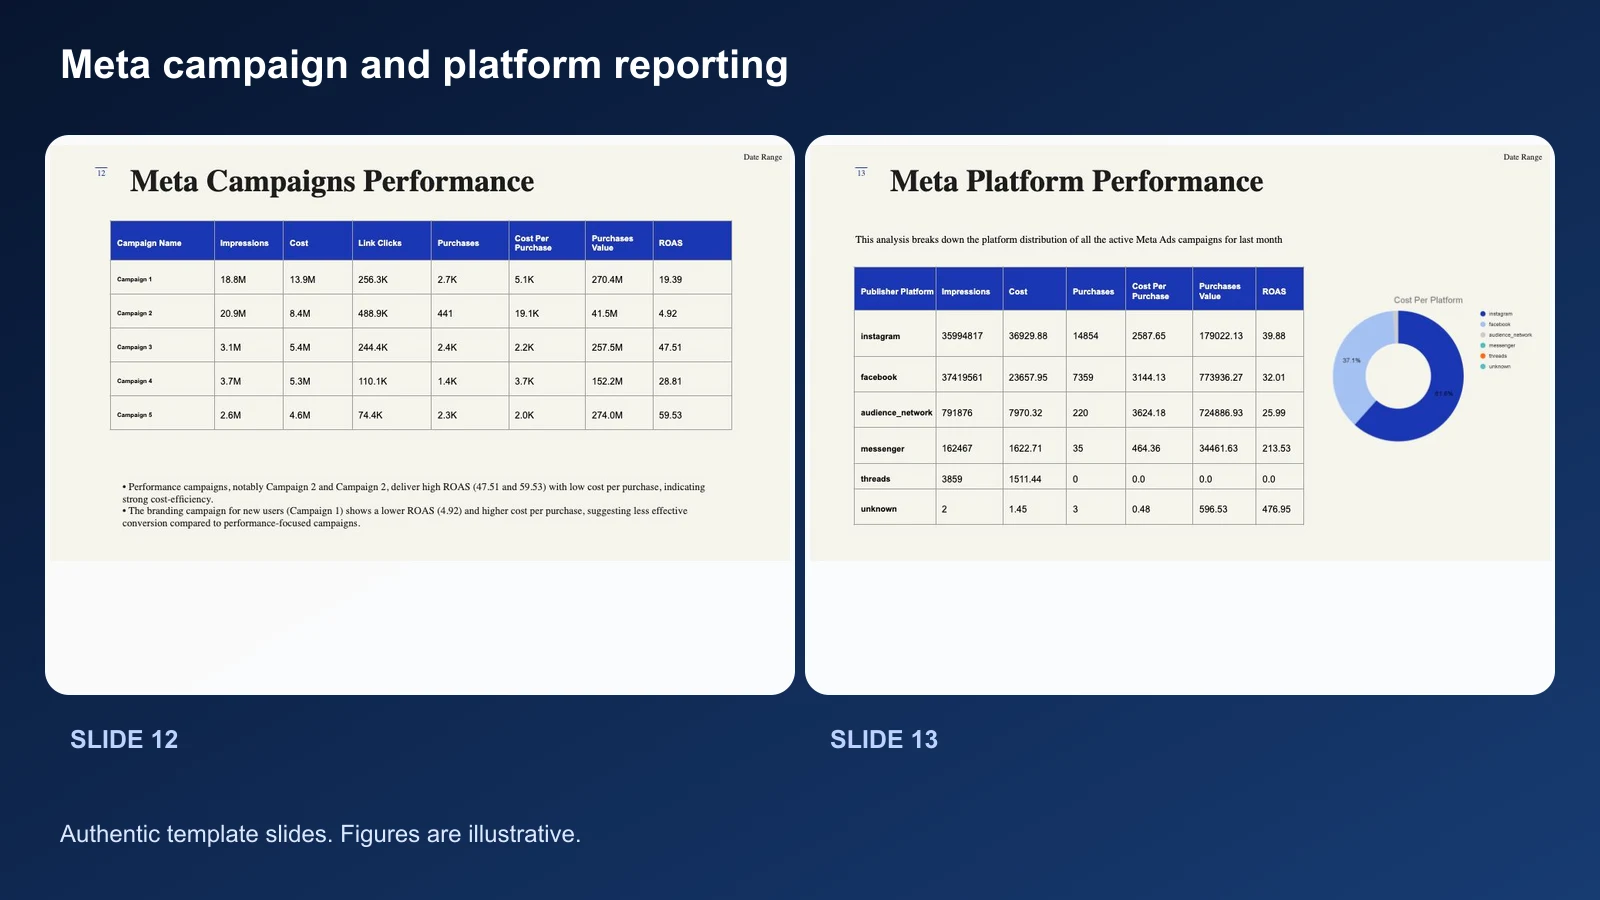
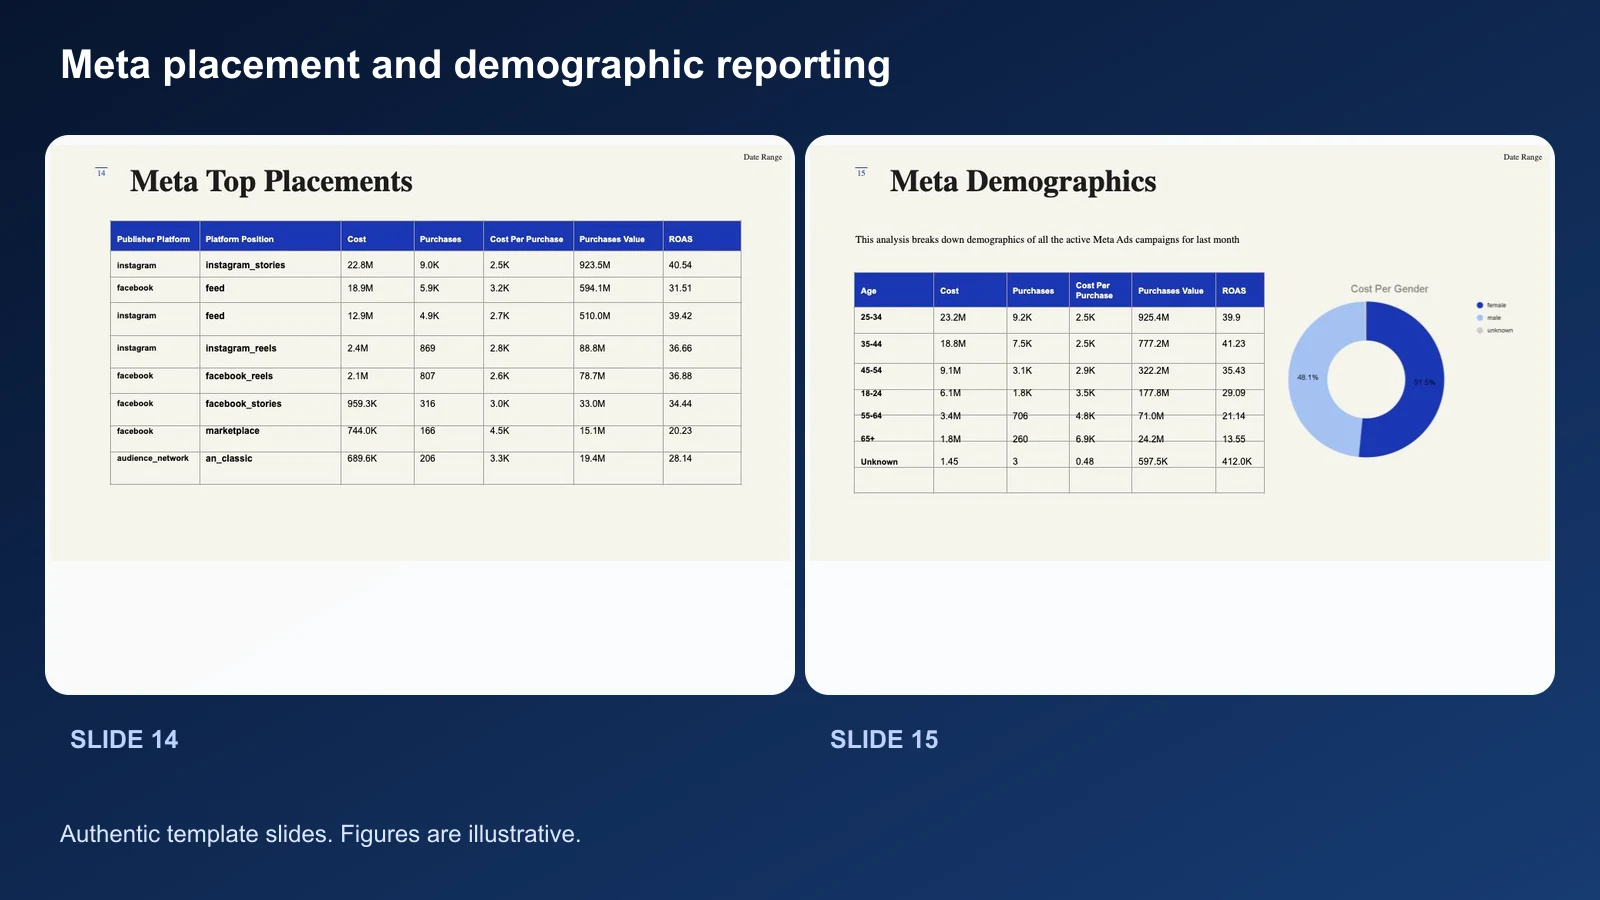
The Meta Ads section follows the same pattern, moving from campaign performance to platform, placement, demographic, and creative breakdowns.
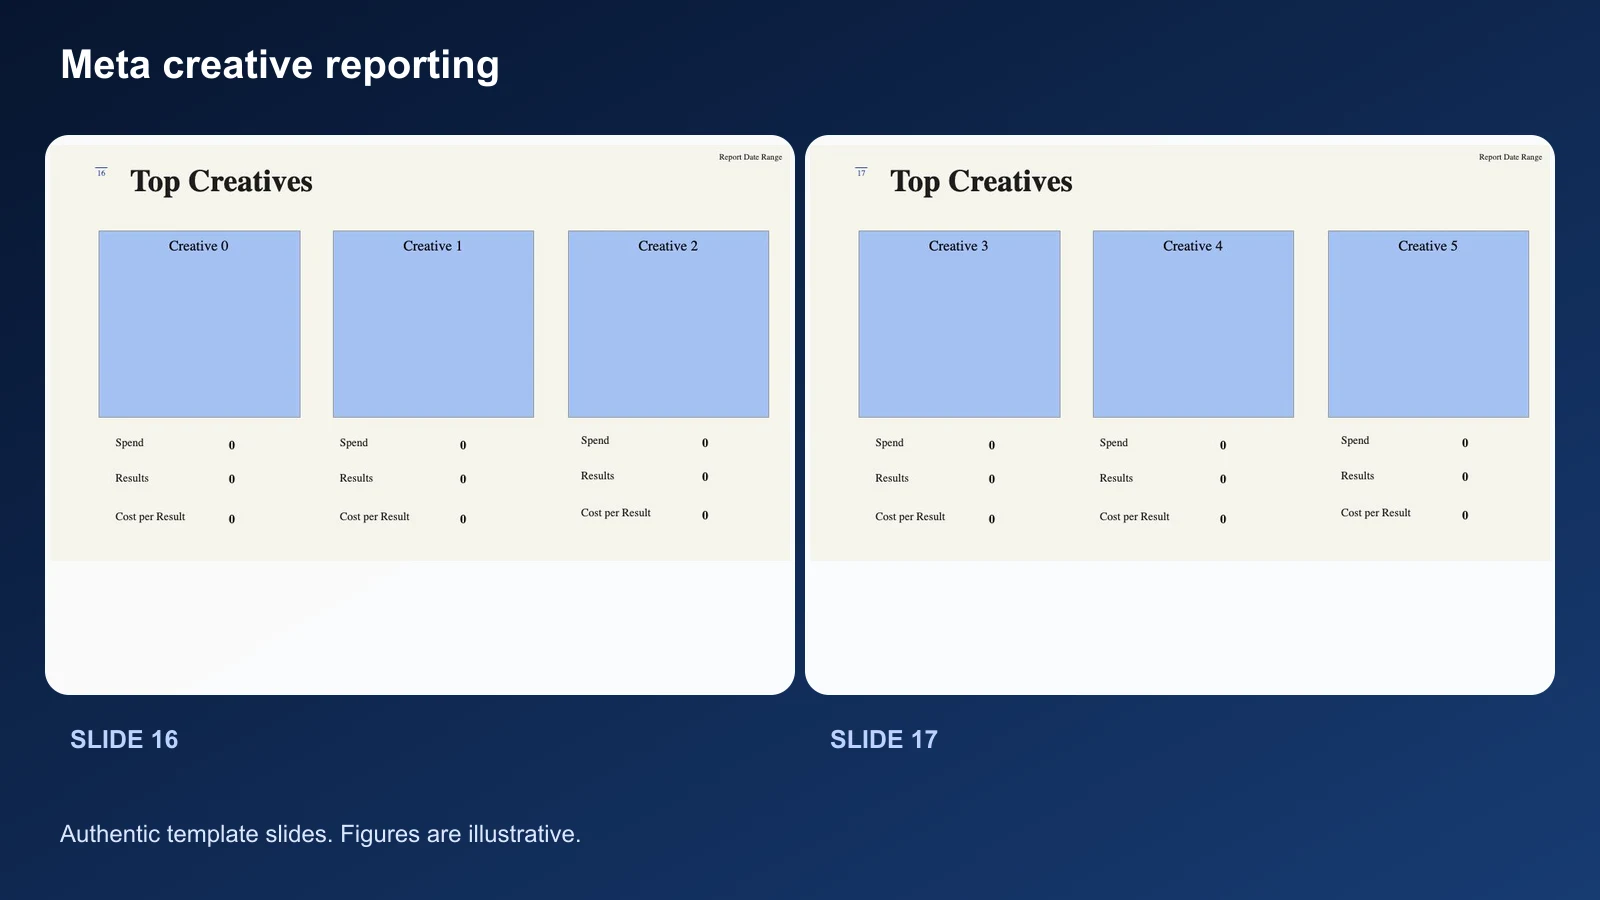
For creative reporting, preserve the ad identifier or creative identifier behind every preview. A screenshot without a stable source reference is difficult to audit or reuse in a recommendation.
Step 8: refresh Google Sheets and Google Slides
Google Sheets is the handoff between normalized data and presentation charts. Write values into named ranges or stable table regions, then refresh the linked chart or replace the chart image in Slides.
Google Sheets supports writing multiple ranges in a batch. Google Slides supports batched presentation updates for text, tables, images, and other page elements. That makes it practical to preserve a designed template while updating only the reporting content.
Use stable placeholders such as:
{{report_date_range}}
{{account_name}}
{{total_spend}}
{{spend_delta_pct}}
{{approved_outcomes}}
{{cost_per_outcome}}
{{executive_summary}}
Avoid placeholders based on position alone, such as “the third text box on slide 2.” Object names, IDs, or unique placeholder text survive layout changes more reliably.
The Google Slides MCP is the relevant Markifact integration when you want an AI client or workflow to read and update a presentation. Developers who prefer a terminal workflow can also use the reporting patterns in the Google Ads MCP with Claude Code guide.
Step 9: QA the report before a client sees it
The workflow can generate the deck. It should not distribute it automatically.
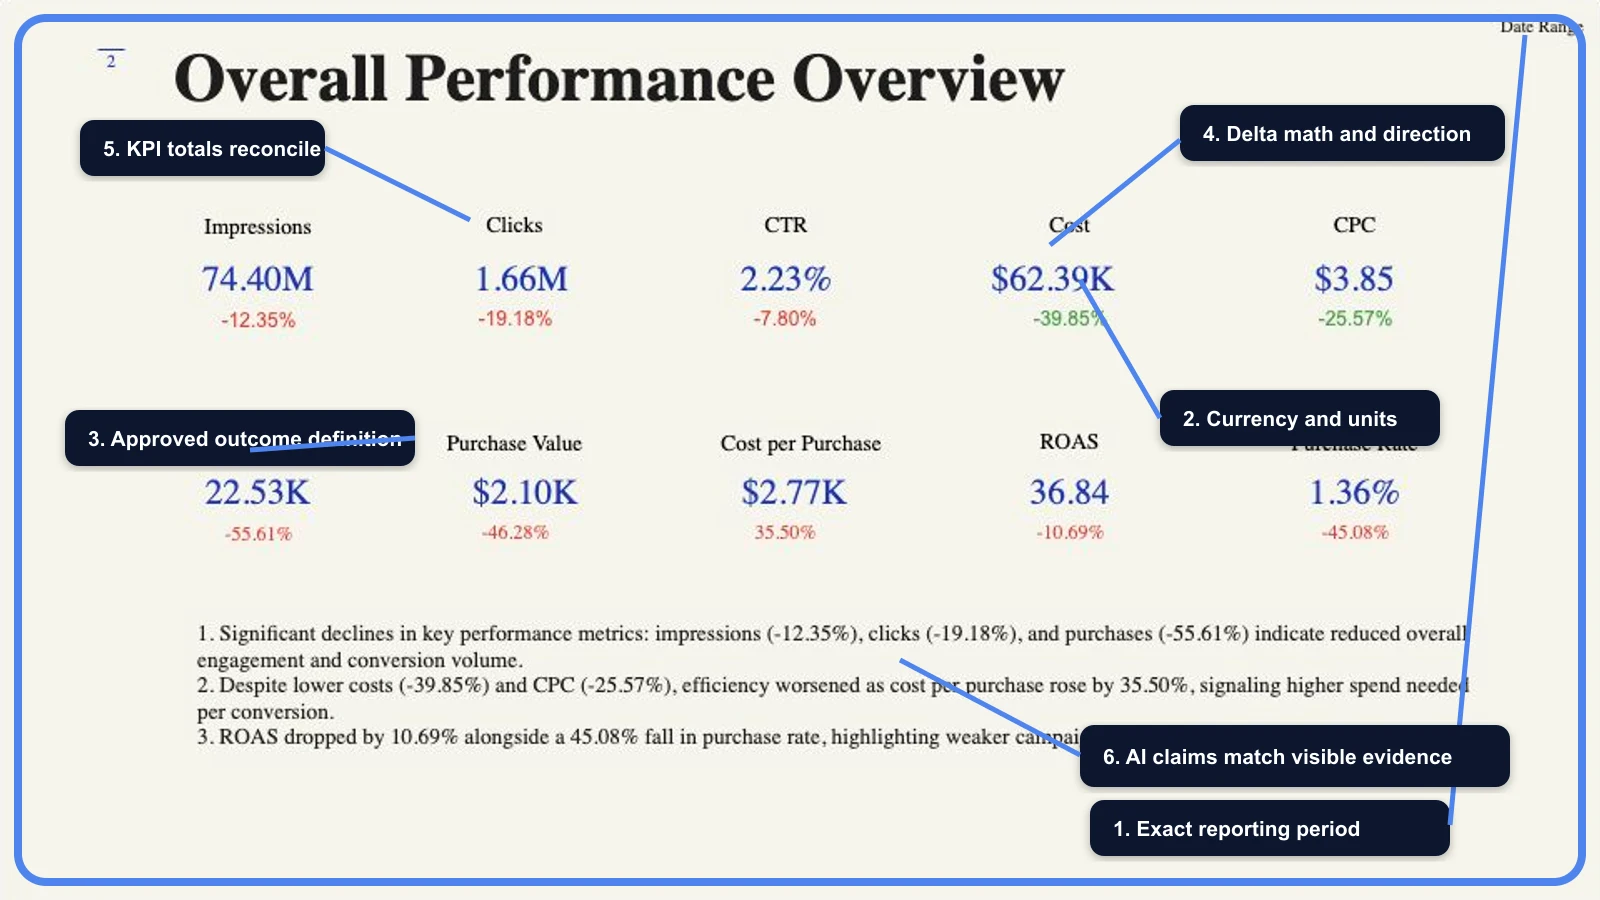
Use this QA gate:
- Correct Google and Meta accounts
- Correct completed dates and comparison dates
- Account timezone and currency
- Approved conversion and purchase definitions
- Meta attribution setting
- Google money units converted correctly
- Missing metrics shown as unavailable, not zero
- Percentage changes guarded against zero denominators
- KPI totals reconcile with the channel table
- Chart dates, labels, totals, and sorting match the source table
- Every AI statement is supported by a visible value or source row
- Creative previews match their ad or creative identifiers
- Final recommendations reviewed by the account owner
Only after those checks should a person share the deck, export the PDF, or use it in a client meeting.
Reuse the workflow next month
Once the contract and placeholders are stable, the monthly process is short:
- Set the new completed reporting month.
- Confirm the comparison period.
- Review account, currency, timezone, outcome, and attribution exceptions.
- Run the same workflow.
- Inspect the QA gate.
- Approve the final narrative and distribute the deck.
The design can change without breaking the workflow if the bound placeholders and object identifiers remain intact. Duplicate the Slides template before a major redesign, then test every automated update against the copy.
If you want the working structure instead of building it from scratch, use the Google and Meta Ads consolidated monthly Slides template.
Frequently asked questions
Can Google Ads and Meta Ads metrics be combined directly?
Spend, impressions, and other compatible metrics can be combined when the accounts use the same currency and period rules. Conversions, purchases, clicks, value, CPA, and ROAS require an explicit definition first.
How should Google conversions and Meta purchases be normalized?
Map them only when they represent the same business event. If they do not, keep separate outcome columns and report channel efficiency against each platform's approved event.
Can the report compare this month with last month automatically?
Yes. Pull both periods with the same account scope and field set, calculate absolute and percentage changes, and return N/A when the prior denominator is zero or unavailable.
Should AI write the client recommendations?
AI can draft recommendations from verified numbers, but a human should review commercial context, tracking limits, account history, and the exact action before the recommendation reaches a client or becomes an ad-platform change.
What still needs manual review?
Account selection, dates, timezone, currency, conversion definitions, attribution, missing data, unusual outliers, calculated totals, chart labels, and every causal or strategic claim need human review.
Can the Slides design be customized without breaking the workflow?
Yes. Keep the bound placeholders, named objects, or stable element IDs intact. Test the workflow against a copied deck after changing layouts, fonts, colors, charts, or table structures.